The improvement of analytics in massive open online courses by applying data mining techniques
Alejandro Mate, Elisa De Gregorio, José Cámara, Juan Trujillo, Sergio Luján-Mora
Expert Systems (ExSy), 33(4), p. 374-382, 2016. ISSN: 1468-0394. https://doi.org/10.1111/exsy.12119
(EXSY'16)
Revista / Journal
JCR IF: 1.180 - Computer Science, Theory & Methods: 59/104 (Q3)
Resumen
The continuous increase in the number of open online courses has radically changed the traditional sector of education during the last years. These new learning approaches are very difficult to manage by using traditional management methods. This is one of the challenges in order to improve the new massive open online courses. In this paper, we propose a big data modelling approach, considering information from a big data analysis perspective, finding out which are the most relevant indicators in order to guarantee the success of the course. This novel approach is described along the paper using the case study of an open online course offered at our university. We describe the lessons learned in this work with the objective of providing general tools and indicators for other online courses. This will enhance the analysis and management of this kind of courses, contributing to their success.
Descarga
Texto completo
1 Introduction
In recent years, the effect of globalization along with the proliferation of open online courses has radically changed the traditional sector of education. New technologies symbolize a big opportunity, but their application also requires to overcome significant challenges in order to take full advantage of them (Allison et al., 2012).
More recently, a new kind of online course has appeared: the massive open online course (MOOC). A MOOC is an online course with the objective of interacting and promoting participation and open access via the web. Apart from the traditional resources such as slides, MOOCs provide video lectures, both offline and online, and user forums that help to build an expert/professional community for the students and instructors. These advantages have allowed MOOCs to quickly gain popularity, and thus, they have been increasing their number of students exponentially during the last years.
Massive open online courses present a significant variety: from simple courses, which have between a few hundred and thousands of students and all the activities are undertaken by them, to the most popular ones with more than 100000 students (for instance, Game Theory course from Coursera, and offered by Stanford University, reached 108371 students enrolled a few days before the start of the course). Some of the amazing numbers from one of the most popular websites, such as Coursera, in this new approach for education are around 116 partner institutions, 964 total courses, 11630289 of students represented in more than 190 countries.
Besides the benefits of these new learning approaches, they also include new challenges and difficulties that render traditional course management methods inadequate for MOOC management. Therefore, there is a need for novel approaches of inclusive delivery that have to be tested with real students (Baker et al., 2012). Among these new challenges, MOOC management faces a significant problem when trying to analyse the information regarding the interaction between students and the course. The dramatic number of simultaneous students interacting with the course creates a flood of data. For example, it is challenging to analyse if any subgroup of students coming from different parts of the world is struggling with certain course materials. Furthermore, the quality of the data provided, not only by the teachers but also by students, such as in their profile or at the user forums, is no longer guaranteed. This can lead to erroneous analysis and difficult course management. According to some authors (Hollands & Tirthali, 2014), the estimated cost of production and delivery of an MOOC can range from $65800 to $325330. Therefore, new tools and analysis methods are needed to capitalize the great effort that lies behind an MOOC.
This is the motivation that leads us to present this work not from an education perspective but from a big data modelling approach. The application of big data to education is a novel approach that can be part of the so-called ‘learning analytics’, an emerging discipline in education (Siemens, 2013). Learning analytics is still in the early stages of research and implementation, and its goal is to better understand teaching and learning.
Big data is characterized by five Vs (three classical Vs, volume, velocity and variety plus veracity and value). Volume is the most common; especially in most popular courses where the interaction of students with their resources produces a huge volume of data. Velocity, in the sense of the growth and activity of the course, which can vary dramatically from one moment to the other, as students enrol from any part of the world as well as new courses appear. Variety is presented through the various demands required by each particular course (i.e. it could be required different amount of practical content, more or less media material, case studies to reinforce theoretical parts and the differences from the number of students enrolled in any course), in short, different types of data (Knox, 2014) (Liljegren & Trombetta, 2014). Finally, value is also another extra V, very useful to indicate the extraction of useful insights from data. It is an indicator of the final value of the data in order to measure quantitatively the data value. Therefore, the value is related to the organization being able to increase or decrease proportionally to internal factors. As a matter of fact, value is a very relative word that depends on the diverse indicators of every particular course.
Therefore, the main goal of this term paper is to model MOOC information from a big data analysis perspective, finding out the most relevant indicators in order to guarantee the success of the course and describing an analysis approach that can be applied to MOOCs in general. To this aim, we show the application of our approach to a case study from an MOOC taught and managed by the University of Alicante. Furthermore, we discuss our implementation and its particularities as well as its generalizability.
The remainder of the paper is organized as follows. In Section 2, we provide a description of our approach to model the information required to manage and analyse the course. Section 3 describes the characteristics of the data sources as well as the steps carried out to process and analyse the data. Section 4 presents graphically the data allowing to understand clearly the indicators. Next, in Section 5, we discuss the lessons learned as a result of our case study. Afterwards, in Section 6, we briefly describe the related work in the area of MOOCs. Finally, in Section 7, we draw the relevant conclusions and sketch future works.
2 Massive open online course analysis and modelling process
In this section, we present the process followed to elicit and model the critical information from the MOOC named UniMOOC, as well as the results of such procedure. UniMOOC is an MOOC that currently has over unique 20000 students registered and focuses on entrepreneurship. It is run by the University of Alicante with the collaboration of a wide variety experts and professors. The information needs were elicited from the organizers (management) of the course, represented by the director of the UniMOOC and ex-president of the university, and the director of e-learning, in conjunction with the IT staff developing the online platform. This would allow management to communicate existing issues and courses of action to be undertaken to the rest of the staff participating in the MOOC.
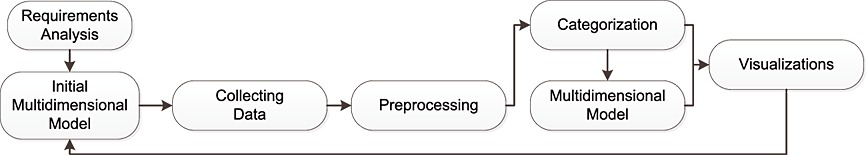
The course includes several units and modules as well as links to social networks for students to interchange opinions. The overall process followed can be seen in Figure 1. First, user requirements are analysed. Then, an initial multidimensional model is obtained. Finally, data are collected and analysed, updating the multidimensional model on each iteration until the final model is obtained.
Our first step to tackle the analytical challenges of UniMOOC at the University of Alicante was to carry out several interviews with the organizers of this course. This provided us some abstract and high-level information about the goals and objectives of course managers, thus being able to derive a first set of indicators and create an initial version of the multidimensional model for analysis. The indicators obtained, which may be applicable to other online courses, are as follows:
- increment in number of students,
- dropout ratio,
- recovery ratio of students,
- percentage of active students,
- percentage of students who fail the course,
- percentage of students passing the exams without seeing the corresponding lessons and
- percentage of students taking the course on a continuous way.
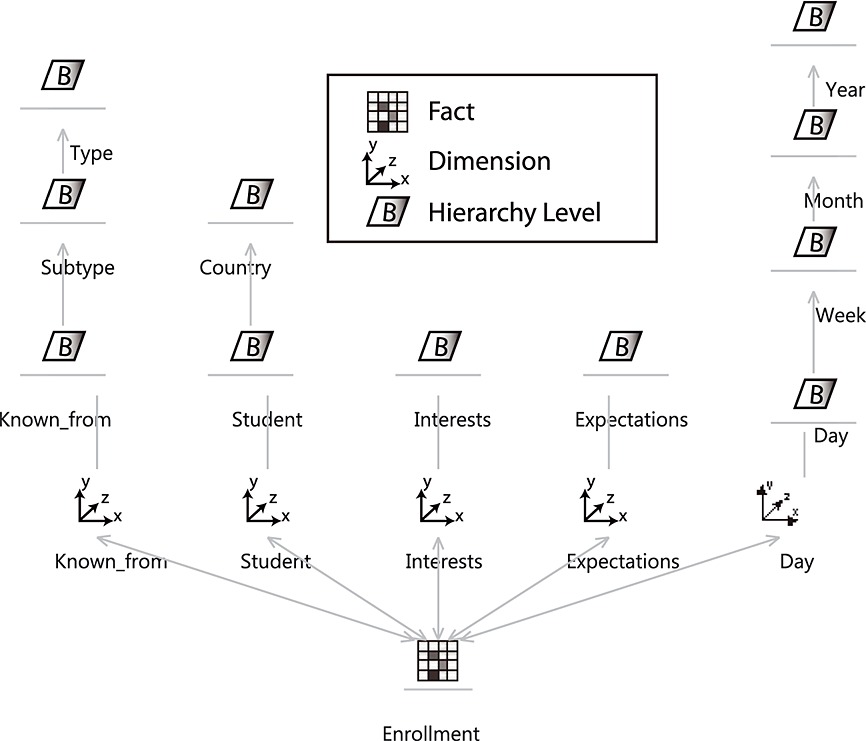
According to these indicators, we created a multidimensional model to support their calculus and provide additional analysis capabilities. The model enables the mapping from the indicators to data warehouse elements, making it possible to generate the logical data warehouse schema automatically. Our multidimensional model is composed of two analysis cubes: ‘enrollment’ and ‘activity’. The first one, ‘enrollment’, allows us to analyse if the characteristics of the students, such as country, interests and expectations, present certain patterns. This multidimensional model can be seen in Figure 2. The data sources available to populate this cube with data were composed by open-ended questions gathered in an online form, to be crossed with student information extracted from the server.
The second cube, ‘activity’, allows us to analyse the interactions of the students with the course, thus identifying dropout points throughout the course, materials, which are usually skipped by the students, or evaluating if altering the order of materials leads to obtaining better results than the previous order. The data sources used to populate this cube were composed of server logs, database tables gathered in Comma Separated Value (CSV) files and data from an internal social network included within the course.
This multidimensional model was created by using the conceptual modelling proposal described in (Lujan-Mora et al., 2006), where the information is organized according to facts (centre of analysis) and dimensions (context of analysis) as shown in Figure 2. Here, we can see the centre of the analysis (fact), which is the ‘enrollment’ process. According to our data as well as our user analysis needs, there are several concepts related to enrollment that are relevant and represent the context of analysis (dimensions). First, we have the ‘known from’ dimension. This dimension gathers information about how a student knew about the existence of the course. According to the categorization process performed, we can differentiate between ‘subtype’ and ‘type’ aggregation levels. ‘Subtype’ contains categories such as ‘newspaper’ or ‘online’, which can be further grouped into ‘type’, such as ‘news’. Next, we have ‘students’. This dimension gathers the information regarding the different students who enrol in the course. As we were not interested in analysing the personal data of individual students, we have grouped them by ‘country’.
Afterwards, we have ‘interests’ and ‘expectations’. The ‘interests’ dimension gathers the interests of the students when joining the course, whereas the ‘expectations’ dimension contains what the students expect to learn from the course. Finally, in order to be able to perform a time series analysis, we have the ‘time’ dimension, containing a standard hierarchy composed of ‘day’ that can be grouped into ‘week’ and then further into ‘month’ and ‘year’.
In addition to this cube, we created another cube to analyse the ‘activity’ of the students. This second cube shares some dimensions with the first one, that is, ‘student’ and ‘time’. However, the information required is different, as knowing the country of the student suffices to analyse student preferences, but not for analysing their interactions with the course. Furthermore, other dimensions had to be added. More specifically, the second cube includes the dimensions ‘lesson’, ‘question’ and ‘LessonLog’. ‘Lesson’ includes information about the lessons, modules and units that comprise the course. ‘Question’ keeps track of the questions that compose self-evaluation activities and assessments. Finally, ‘LessonLog’ is a special dimension included to satisfy the requirement of analysing the order of ‘unit/module/lesson’ followed by the students when interacting with the course as opposed to the order proposed by the course itself.
Our cube models can make education data intelligible to a wide variety of audiences, in the same way as visualizations, diagrams, infographics and other forms of representation (Williamson, 2014). These cube models are much more understandable than the data itself. Furthermore, they were also used as templates to automatically derive the data warehouse schema and provided the necessary scaffolding to perform more advanced analytics, such as data mining. However, the necessary data to populate these cubes were dispersed across several kinds of data sources, including unstructured data and inaccurate data. Thus, we had to analyse these data in detail, in order to obtain the information that we needed and also to identify potential changes in the analysis structure.
3 Data analysis
In order to populate the initial multidimensional models, it was necessary to create a catalogue and analysis of the data sources available. As each source had its own characteristics, we had to evaluate its format and the quality of the data before loading it into the data warehouse. For these tasks, we used Pentaho Data Integration, which is an extraction/transformation/loading (ETL) tool.
The first data source was the server logs that monitored the activity of the students. These server logs were saved in ‘JavaScript object notation’ format, which is a list of pairs containing variables and values. These logs had to be parsed and integrated with the course information. As we focused strictly on gathering the answers of the students, we linked each entry with the corresponding elements in the multidimensional model.
Our second data source was in the form of structured server tables. These server tables were integrated within the NoSQL database included in the Google App Engine that supports the MOOC. Because we did not have direct access to the tables to query them, we got a copy of their contents in the form of csv files. Each of this csv files contained information about a certain element involved in the course, such as ‘lessons’, ‘modules’ or ‘assessments’, and required to be adequately integrated in order to obtain basic information, that is, ‘which assessment corresponds to each module’? or ‘what is the order of the lessons in the course’?
It is noteworthy that although it may be expected that server tables would be the easiest source to integrate, it was quite the opposite. First, when analysing the information provided by students, we found out that even the information selected from predefined lists contained several errors. For example, some students selected their country but did not specify their city. Others specified their city but did not select a country. For example, we ended up with ‘Madrid’, the capital of Spain, being a city of ‘Abjasia’, former republic of the Soviet Union, according to the data available. In order to solve this problem, we included an additional external source to validate each pair city–country and correct the inaccurate ones. Second, the information stored in server tables did not accurately reflect the state of the course when some interactions registered in server logs took place. For example, there were students who had followed a different lesson order than the currently established. In order to deal with these situations, we modified our multidimensional models, including an additional dimension, ‘LessonLog’, which was presented in Section 2, as well as several attributes to include the missing information.
Finally, the third data source was course forms. Course forms were included in the course to gather students' expectations, interests and identifying where students heard about the course. The information was mostly gathered in the form of open-ended questions. However, we found out that, in addition to being highly variable, the information stored was also highly inaccurate. For example, questions such as ‘where did you know about the course’? could refer to a certain source by name or be as general as ‘Internet’. Therefore, in order to solve this problem, we performed a text mining and categorization process, which is described throughout Sections 3.1 and 3.2.
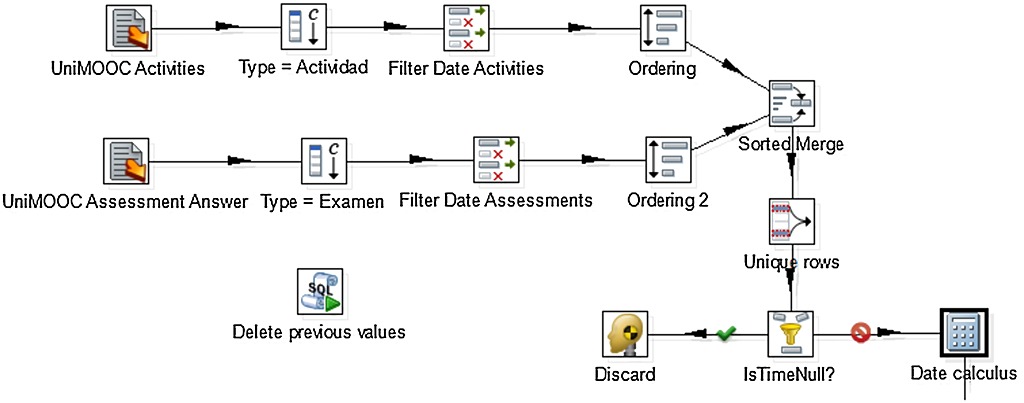
An example of the ETL processes designed for cleaning and extracting information from these data sources can be seen in Figure 3. In this figure, the relevant dates from activities and assessments captured in server logs are integrated into the analysis model. In order to perform this process, date data are extracted from the sources and then listed removing duplicates. Finally, additional data such as month names and days of the year are added to the flow before loading it into the analysis model.
The load of the initial data, and especially the analysis and processing of the different data sources, led us to the emergence of new elements that altered the structure of the analysis, thus requiring to repeatedly adapt and update the data modelling scheme. As it is common to discover new elements and relevant information as highly heterogeneous sources are explored, we adopted an iterative procedure to tackle this problem. This procedure can be seen in Figure 1. Initially, data are gathered from each data source. Then they are preprocessed according to a certain set of rules, that is, regular expressions that ensure that data format is correct, null values filtered out and so on. Finally, data are visualized either directly, in a stand-alone way, to evaluate its quality or to provide further understanding, or they are integrated within the multidimensional model, leading to a new version of the model. Then, the new multidimensonal model is visualized in order to evaluate the result of the integration step. Afterwards, the cycle starts again, using the newly gained understanding to perform modifications on the procedure steps, that is, ETL processes and natural language processes.
In the case of unstructured data, a categorization step is performed in order to provide some basic structure and allow the integration with the rest of the data available. Most of the unstructured data involved in our analysis came from course forms. Although this source contained valuable information gathered from over 10200 students (it was referenced before as 20000 students registered, and 10200 is the number after the dropout happened), it was necessary to understand its contents and manage its variability in order to obtain meaningful information. The processing of this unstructured data led to the iterative addition of the dimensions previously shown in Figure 2, and it is detailed in the following subsections.
3.1 Preprocessing and text mining
The information stored in the different fields within course forms was mainly textual and needed to be preprocessed in order to be evaluated. In this regard, we extracted the words most frequently used in each field. For this task, we transformed each string into a vector, by using ‘StringToWordVector’, which is a filter that is built into Weka (Witten et al., 2011). Weka is an open source toolbox containing a collection of machine learning algorithms developed at the University of Waikato.
As a result of the application of the ‘StringtoWordVector’, we obtained a set of word occurrence frequencies, which described the words most commonly used by the students when filling the form. Using this information, we proceeded to the creation of categories.
3.2 Categories creation
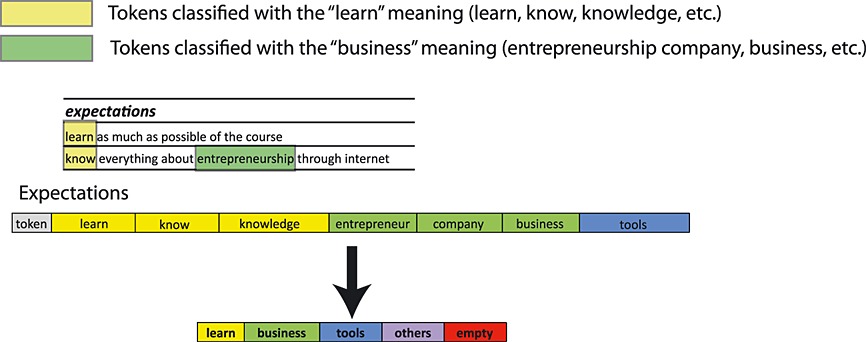
As we can appreciate in Figure 1, which represents the iterative schema followed in this work, once the procedure of word occurrence frequencies (preprocessing step according to the text mining) was finished, we evaluated the information obtained. As a result, we decided to categorize words according to the dimensions indicated in the model shown in Figure 2. Specifically, the ‘known from’ dimension presented a classification within different levels of abstraction. Therefore, we added an analysis hierarchy including types and subtypes. Afterwards, we modified the steps to automatically classify the information according to the semantical meaning of the different word occurrence (tokens) that appeared in the unstructured textual data gathered in course forms.
An example of this procedure showing the process for the expectations and interests dimensions of the enrollment modelling can be seen in Figures 4 and 5. We can appreciate on the left side the procedure where the tokens are extracted from the text. On the right side, the categorization is carried out by grouping similar semantic meaning in natural language.
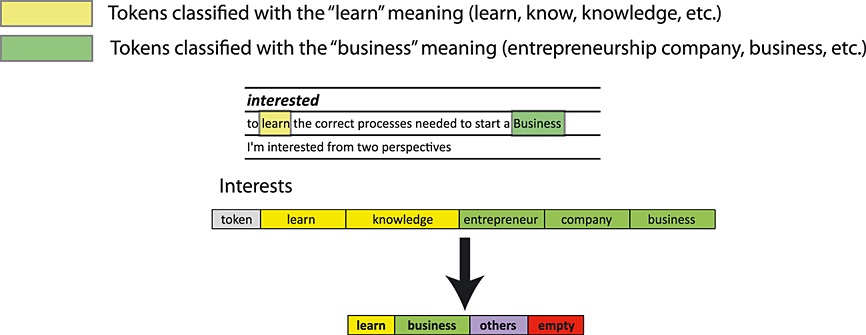
This method proved to be useful during the first iteration of the MOOC, where time for the analysis was constrained and the natural language input was limited. However, more advanced techniques (Abney et al., 2000; Soubbotin & Soubbotin, 2001; Nasukawa & Yi, 2003; Wallach, 2006; Pang & Lee, 2008; Andrzejewski et al., 2009; Taboada et al., 2011; Blei, 2012) for tackling this process can be used, which can be specially interesting when integrating data from the social network. Among the more advanced techniques, we can find deeper natural language processing (Abney et al., 2000; Soubbotin & Soubbotin, 2001), topic modelling (Wallach, 2006; Andrzejewski et al., 2009; Blei, 2012) and sentiment analysis (Nasukawa & Yi, 2003; Pang & Lee, 2008; Taboada et al., 2011). First, deeper natural language processing takes into account not only the answer of the student but also the question posed. This can help to better identify the answer of the student and ignore words that are irrelevant. Second, topic modelling (Wallach, 2006; Andrzejewski et al., 2009; Blei, 2012) uses bags of words and n-gram models to identify the topic on a certain text. This allows us to go beyond word counting and even semantic similarity in order to extract more general concepts from discussions in the social network or even in the enrollment forms descriptions. Third, sentiment analysis (Nasukawa & Yi, 2003; Pang & Lee, 2008; Taboada et al., 2011) is comprised by a set of techniques to evaluate the positive or negative sentiment in a text talking about a certain topic. It has been extensively used to evaluate the general sentiment over news and trending topics that appeared on Twitter. In a similar way, it can be used to evaluate the overall feeling of students before and after taking the course, as well as their perception of the different modules included in the course. This information can prove very useful to identify problematic lessons that need to be improved or replaced.
4 Visualization
Because of the big amount of data of this course, the best way to analyse these data was by using simple and clear visualization methods. Figure 6 shows three pie charts where the division into sectors is crucial to illustrate numerical proportions. We have to take into account that in both Figures 6 and 7, the datasets that are analysed contain only the data related to students before the course started. This is important to find out the expectations, interests and so on from the students in order to improve the courses, especially in future editions.
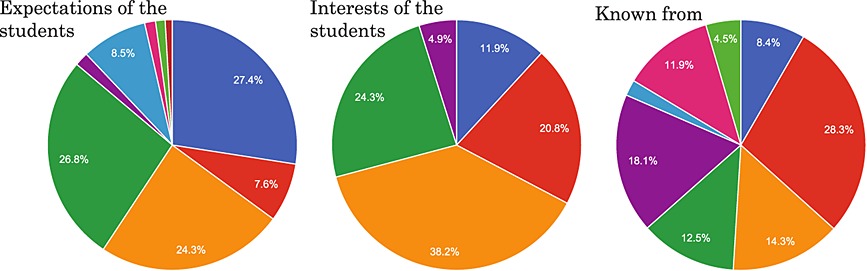
Figure 6a represents the expectations of the students. Figure 6b shows the interests of the students. Figure 6c indicates the sources from where the students have first known about the course.
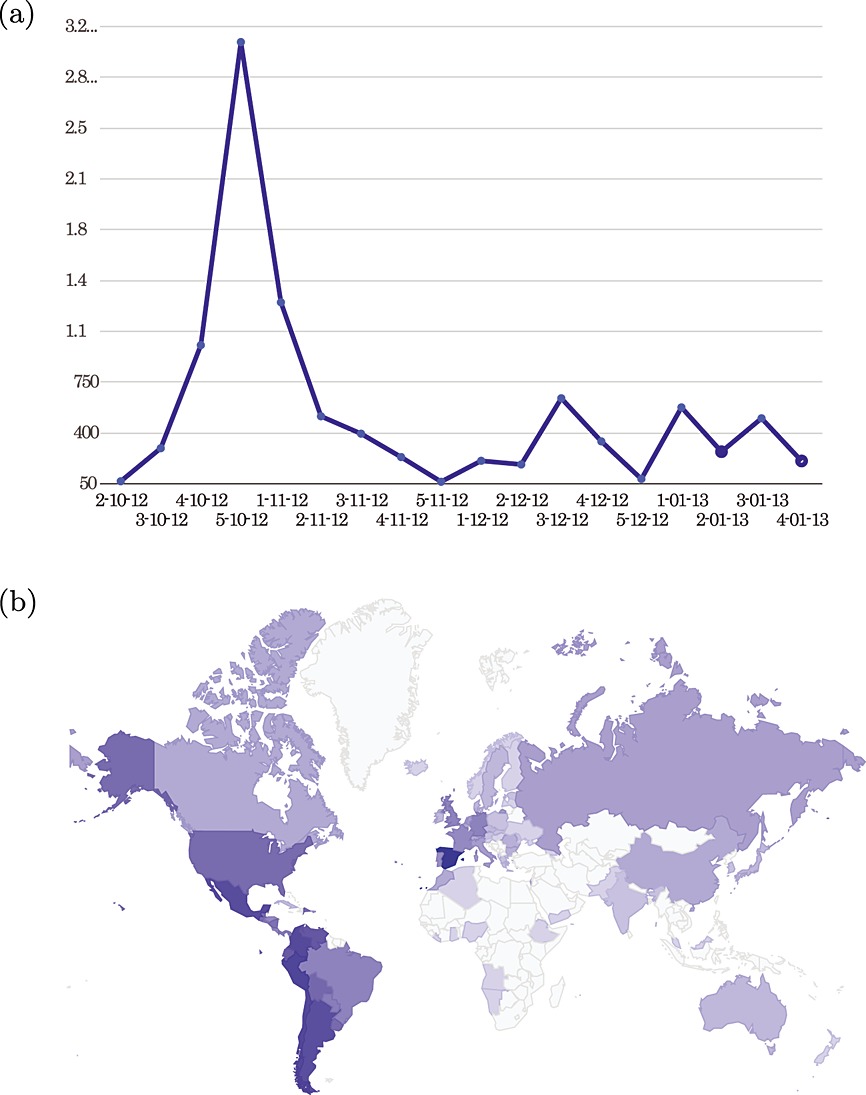
Figure 7 allows us to see the quantity of enrollment per day. It is obvious to note that the last dates before the deadline as well as those extra days if the deadline has been extended have a higher number of students. The second part of Figure 7, the map, represents the origin of the students. Here, we can also note that the countries with Spanish as the official language are the ones with the largest number of enrollments.
5 Lessons learned
In this paper, we have described the process followed to provide multidimensional analysis support in the case study of an MOOC at the University of Alicante. Initially, the project started with the creation of static models and direct data analysis. However, this approach was quickly dismissed because of several reasons. First, the lack of a clear direction had a dramatic effect, because we had to choose between a number of different data processing and analysis techniques without knowing beforehand if we would obtain any significant result, thus making time and effort futile in most cases. Second, the evaluation of results was challenging itself, because only clearly marked patterns could be identified as noteworthy. Third, the static models were continually being scrapped, as whenever the point of view on the data changed, the models did no longer fit.
Therefore, we scrapped this approach and started over again focusing on an iterative process. Having a clear point of view on the data, thanks to including domain knowledge and gathering a list of indicators, helped to determine which was the best way to integrate the variety of data sources that comprised all the information related to the course. Furthermore, this domain knowledge also allowed us to highlight the problem related to managing information uploaded by users, as even in the case of predefined lists, it can be highly inaccurate.
In addition, because the course makes use of the Google App Engine platform employed by many online courses, we think that the set of indicators identified, as well as our approach itself, can be applied to online courses in general, thus enabling better analysis and better management of the courses.
Furthermore, we have also confirmed that traditional management and traditional analysis approaches are not suitable for MOOCs. The volume of interactions between students and the course, as well as the amount of different sources and unstructured data dramatically increases the complexity of a traditional analysis, while at the same time limiting the knowledge that can be obtained from such analysis. Therefore, we consider that following an iterative process (customizable, adaptable and updateable), including early indicators that provide guidance about what to analyse and how to integrate the data, is compulsory. Otherwise, much effort and time will be wasted, leading to a high probability of failure.
Finally, thanks to the analysis, we have identified what modules are more popular, the presence of bots who repeat tests constantly and what tests are too complex for the students, among others.
6 Related work
In this section, we briefly cover the related work in the area of MOOC analytics and big data. Most of the works until now have been focused on analysing the challenges and opportunities related to approaching MOOC analysis from a big data perspective. In Allison et al. (2012), the authors express that this new situation poses a revolution in education, while the EdX initiative (Harvard, 2012) by Harvard and Massachusetts Institute of Technology (MIT) state ‘with an Internet connection, anyone anywhere in the world, can have (free) access to video lessons, online laboratories, quizzes’. Next, Brada et al. (2012) explain the challenges as well as the changes in higher education and international rankings of universities. In Schutlz, (2013), the authors addressed similar targets as we do in this work. However, none of these works cover the experimentation and implementation aspects. Finally, Bienkowski et al. (2012) presents a report of big data for student learning indicating new forms of assessment as well as the need of interconnected feedback loops among the diverse parts of the whole process (students, teachers, administrators and developers). They propose a learning registry open-source community for sharing social metadata and have experimented with a number of organizations representing their social metadata using that schema. To the best of our knowledge, all these previous works have not used a novel and dynamic architecture to face the big data analytics in education. This is the reason that lead us to go a step further to propose this novel approach and tackle the analysis problem for MOOCs.
7 Conclusions
In this paper, we have presented a novel approach to model MOOC data from a big data perspective. Our work addresses two of the hottest topics in education technology: MOOCs and learning analytics (Knox, 2014). As we discussed, the particularities of MOOCs compared with classical courses render traditional management and analysis approaches ineffective, and therefore, they require the application of more dynamic paradigms in order to be managed adequately. We have shown how applying a big data perspective can aid in the analysis of the variety of data available, ranging from server logs to student inputs, and in some cases including social network data. Furthermore, we have elicited a set of indicators that may be applied for managing other online courses, and we have highlighted the key factors found while implementing the case study. There still are several challenges for MOOC management, because the amount of requirements can vary from one course to another. The compliance of those requirements and the capability to analyse the data according to them will be crucial to the success of the courses. The development and marketing efforts in an MOOC must be ‘crafted and executed carefully and strategically’ (Liljegren & Trombetta, 2014). In order to meet this requirement, the following questions should be asked and answered:
- What is our target/market demographic?
- Who typically enrols in our courses?
- Who would find this information useful?
In this paper, we have showed how to answer these and other questions thanks to our approach to model MOOC data from a big data perspective. The information gathered and analysed by our approach can help MOOC decision makers to identify potential students and to decide on what courses to offer.
Our future work includes integrating the social network information, which was left outside the initial iteration, as well as consider additional sources of information outside the course, because more data about student behaviours and activities could provide greater accuracy in prediction and personalization (Knox, 2014). The final goal is to fix some of the long-standing problems of higher education.
Acknowledgements
This work has partially funded by the project GEODAS-BI (TIN2012-37493-C03-03) from the Ministry of Economy and Competitiveness (MINECO). Alejandro Maté is funded by a Vali+D grant (APOSTD/2014/064). We would also like to thank the group at UniMOOC for their contributions.
References
ABNEY , S., M. COLLINS and A. SINGHAL (2000) Answer extraction.In: Proceedings of the sixth conference on Applied naturallanguage processing. pp. 296–301. Association for ComputationalLinguistics.
ALLISON , C., A. MILLER , I. OLIVER , R. MICHAELSON and T. TIROPANIS (2012) The web in education, Computer Networks,56, 3811–3824.
ANDRZEJEWSKI , D., X. ZHU and M. CRAVEN (2009) Incorporating domain knowledge into topic modeling via Dirichlet forest priors.In: Proceedings of the 26th Annual International Conference onMachine Learning. pp. 25–32. ACM.
BAKER , P.M., K.R. BUJAK and R. DEMILLO (2012) The evolving university: disruptive change and institutional innovation,Procedia Computer Science, 14, 330–335.
BIENKOWSKI , M., J. BRECHT and J. KLO (2012) The learning registry:building a foundation for learning resource analytics. In:Proceedings of the 2nd International Conference on LearningAnalytics and Knowledge. pp. 208–211. ACM.
BLEI , D.M. (2012) Probabilistic topic models, Communications of theACM, 55, 77–84.
BRADA , J.C., W. BIENKOWSKI and G. STANLEY (2012) The University in the Age of Globalization: Rankings, Resources andReforms, New York: Palgrave Macmillan.
HARVARD, M.I.T. (2012) EdX: Edx courses. http://www.edxonline.-org. [accessed 30 May 2015].
HOLLANDS , F.M. and D. TIRTHALI (2014) MOOCS: Expectations and Reality. Center for Benefit-cost Studies of Education, TeachersCollege, Columbia University, New York, NY.
KNOX , J. (2014) From MOOCS to learning analytics: scratching thesurface of the ‘visual’, eLearn, 2014, 3.
LILJEGREN , D.G. and L. TROMBETTA (2014) Finding your nicheduring the MOOC revolution, eLearn, 2014, 1.
LUJAN-MORA , S., J. TRUJILLO and I.Y. SONG (2006) A UML profile for multidimensional modeling in data warehouses, Data and Knowledge Engineering, 59, 725–769.
NASUKAWA , T. and J. YI (2003) Sentiment analysis: capturingfavorability using natural language processing. In: Proceedingsof the 2nd international conference on Knowledge capture. pp.70–77. ACM.
PANG , B. and L. LEE (2008) Opinion mining and sentiment analysis,Foundations and Trends in Information Retrieval, 2, 1–135.
SCHUTLZ , N. (2013) Classes in the cloud, New Scientist, 217, 55–64.
SIEMENS , G. (2013) Learning analytics: the emergence of a discipline,American Behavioral Scientist, 57, 1380–1400.
SOUBBOTIN, M.M. and S.M. SOUBBOTIN (2001) Patterns of potentialanswer expressions as clues to the right answers. In: TREC.
TABOADA, M., J. BROOKE , M. TOFILOSKI , K. VOLL and M. STEDE (2011) Lexicon-based methods for sentiment analysis,Computational Linguistics, 37, 267–307.
WALLACH , H.M. (2006) Topic modeling: beyond bag-of-words. In:Proceedings of the 23rd international conference on Machinelearning. pp. 977–984. ACM.
WILLIAMSON, B. (2014) New centers of data visualization ineducation. DML central. July 20.
WITTEN , I.H., E. FRANK and M.A. HALL (2011)Data mining. InPractical Machine Learning Tools and Techniques, third editionedn., Morgan Kaufmann, Boston, 539–557.