Reducing Inconsistency in Data Warehouses
Sergio Luján-Mora, Enrique Medina
Proceedings of the 3rd International Conference on Enterprise Information Systems (ICEIS 2001),
p. 199-206: ICEIS Press, Setúbal (Portugal), July 7-10 2001.
(ICEIS'2001)
Congreso internacional / International conference
Resumen
A data warehouse is a repository of data formed of a collection of data extracted from different and possible heterogeneous sources (e.g., databases or files). One of the main problems in integrating databases into a common repository is the possible inconsistency of the values stored in them, i.e., the very same term may have different values, due to misspelling, a permuted word order, spelling variants and so on. In this paper, we present an automatic method for reducing inconsistency found in existing databases, and thus, improving data quality. All the values that refer to a same term are clustered by measuring their degree of similarity. The clustered values can be assigned to a common value that, in principle, could substitute the original values. Thus, the values are uniformed. The method we propose provides good results with a considerably low error rate.
Descarga
Texto completo
1 INTRODUCTION
Data warehouses (DW) are used for the decision support process, which manages huge volumes of data. A DW is a repository of integrated data from distributed, autonomous, and possibly heterogeneous sources (Inmon, 1992).
Data cleaning (cleansing) is the process of removing errors and resolving inconsistencies in source data before loading them into a common repository. The aim of data cleaning, which is especially required when integrating heterogeneous data sources, is improving data quality (Rahm, 2000).
DW are populated by the data flowing from source systems such as operational files and transactional databases. In DW, data cleaning is a major part of the so-called ETL (Extraction, Transformation and Loading) process (Chaudhuri, 1997).
Furthermore, data quality is one of the fundamentals of success in the DW environment. The discovery of incorrect data weakens the end users' confidence in the data even if the unit of data that is incorrect is minimum.
Thus, if the information contained in database instances is inconsistent (i.e., if a given term appears with different values because several denominations exist, or because it is misspelled), it will produce incorrect or misleading results. The erroneous results could lead us to wrong business decisions.
The problem of the inconsistency found in the values stored in databases may have three principal causes:
- If the number of possible values that a single field can accept is not controlled, a given person, (or different persons), may insert the same term with different values. For instance, a database that stores the names of the departments of a university may have several different forms (e.g., the use of upper-case letters or abbreviations): “Departamento de Lenguajes y Sistemas Informáticos”, “Depto. de Lenguajes y Sistemas Informáticos”, “Dpt. de lenguajes y sistemas informáticos”, etc.
- When we try to integrate different databases into a common repository (e.g., in a DW), one or more of them may suffer from the above-mentioned problem. The consistency of their contents has been guaranteed separately. However, the criteria used for establishing the consistency of each one might well be different and integrating them all could cause inconsistency problems. For example, we wish to integrate three different databases that store bibliographical information. The authors might well appear in different forms in each one: i.e., full names, “Miguel de Cervantes Saavedra”, or by last names first and then the first name, “Cervantes Saavedra, Miguel de”, or by first name and last name only, “Miguel de Cervantes”.
- Another problem is the multilinguality. In a multilingual society (e.g., European Community) it is common to find official names written in different languages. For instance, we consult a database that stores information about university researchers, (e.g., researcher’s name, researcher’s university, etc.), and we wish to obtain a list of all of the researchers who work at the University of Alicante. We may easily find that there are different values for this university: “Universidad de Alicante” (in Spanish), “Universitat d'Alacant” (in Catalan), “University of Alicante” or “Alicante University” (in English), and “Université d'Alicante” (in French).
The remainder of the paper is structured as follows: Section 2 outlines the origin of the problem and the possible causes that give rise to the different variants that appear for the same term; Section 3 introduces our method for reducing inconsistency found in existing databases: identifying similar values concerning the same real world entity; Section 4 explains the core of our study and details the technical aspects of our method; Section 5 provides an evaluation of the method; and finally, our conclusions are presented in Section 6.
2 ANALYSIS OF THE PROBLEM
After analysing several databases with information both in Spanish and in English, we have noticed that the different values that appear for a given term are due to a combination of the following eight causes:
- The omission or inclusion of the written accent: “Asociación Astronómica” or “Asociacion Astronomica”.
- The use of upper-case and lower-case letters: “Departamento de Lenguajes y Sistemas Informáticos” or “Departamento de lenguajes y sistemas informáticos”.
- The use of abbreviations and acronyms: “Dpto. de Derecho Civil” or “Departamento de Derecho Civil”.
- Word order: “Miguel de Cervantes Saavedra” or “Cervantes Saavedra, Miguel de”.
- Different denominations: “Unidad de Registro Sismológico” or “Unidad de Registro Sísmico”.
- Punctuation marks (e.g., hyphens, commas, semicolons, brackets, exclamation marks, etc.): “Laboratorio Multimedia (mmlab)” or “Laboratorio Multimedia – mmlab”.
- Errors: Misspelling (apart from the written accent), typing or printing errors (absence of a character, interchange of adjacent characters, etc.): “Gabinete de imagen” or “Gavinete de imagen”.
- Use of different languages: “Universidad de Alicante” (Spanish) or “Universitat d’Alacant” (Catalan).
There has been great interest in studying the quality of the information stored in databases for a long time ((Motro, 1998), (O’Neill, 1988), (O’Neill, 1989)), and diverse methods have been developed for the reduction of the inconsistency found in databases ((Hernández, 1998), (Monge, 1997)).
3 INTUITIVE PROPOSAL OF A METHOD TO REDUCE THE INCONSISTENCY FOUND IN DATABASES
The method we propose in this paper improves our previous works (Luján-Mora, 2000b) that were developed from French’s automatic creation of authority files for bibliographical catalogues ((French, 1997a), (French, 1997b)). We have added new distances, developed different evaluation measures and employed a different clustering algorithm. These improvements result in a better performance of the method.
Our algorithm resolves all the problems detailed in Section 2, except the fifth and the eighth, which depend on how different the two strings that represent the same term are. The method that we propose can be divided into six steps:
- Preparation. It may be necessary to prepare the strings before applying the clustering algorithm.
- Reading. The following process is repeated for each of the strings contained in the input file: Read a string Expand abbreviations and acronyms Remove accents: e.g., A substitutes Á and À, and a substitutes á and à Shift string to lower-case Store the string: If it has been stored previously, its frequency of appearance is increased by one unit
- Sorting. The strings are sorted, in descending order, by frequency of appearance.
- Clustering. The most frequent string is chosen and it is compared to the rest of the strings, using a measure of similarity. This process is repeated, successively, until all the strings have been clustered.
- Checking. The resulting clusters are verified and the possible errors are located and corrected.
- Updating. The original database is updated. The strings of a cluster are replaced by its centroid.
4 TECHNICAL DESCRIPTION OF THE METHOD
In this section, technical aspects of our method are described. We start by introducing a previous processing for obtaining better results in Section 4.1. Section 4.2 describes how the similarity between two strings is considered. Section 4.3 presents the algorithm itself and finally, Section 4.4 explains the last step of the method, i.e., checking that the obtained clusters are correct.
4.1 Previous Processing
The strings undergo a previous processing to obtain better results from the clustering. The objective of this processing is to avoid the three first causes of the appearance of different forms for the same term (see Section 2.1.): i.e., accents, lower-case/upper-case and abbreviations. The accents are eliminated, the string is converted to lower-case and the abbreviations are expanded.
4.2 String Similarity
The similarity between any two strings must be evaluated. There are several similarity measures; in our research, we employ five measures: Levenshtein distance (LD), invariant distance from word position (IDWP), a modified version of the previous distance (MIDWP), Jaccard’s coefficient (JC), and the minimum of the four previous measures (CSM).
The edit distance or Levenshtein distance (LD) (Levenshtein, 1966) has been traditionally used in approximate-string searching and spelling-error detection and correction. The LD of strings x and y is defined as the minimal number of simple editing operations that are required to transform x into y. The simple editing operations considered are: the insertion of a character, the deletion of a character, and the substitution of one character with another. In our method, we have taken a unitary cost function for all the operations and for all of the characters. The LD of two strings m and n in length, respectively, can be calculated by a dynamic programming algorithm (Hirschberg, 1997). The algorithm requires ?(mn) time and space.
If two strings contain the same words (variant forms of the same term) but with a permuted word order, the LD will not permit their clustering. To solve this problem, we introduce another distance that we call the invariant distance from word position (IDWP) (Luján-Mora, 2000a). It is based on the approximate word matching referred to in (French, 1997b). To calculate the IDWP of two strings, they are broken up into words (we consider a word to be any succession of digits and letters of the Spanish alphabet). The idea is to pair off the words so that the sum of the LD is minimised. If the strings contain different numbers of words, the cost of each word in excess is the length of the word.
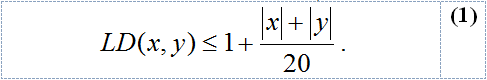
We also use a modified IDWP (MIDWP). We add a new matching condition: if two strings fulfil Equation 1, we assume they match perfectly (in that case, we consider their LD is zero).
The last similarity measure we have employed is the Jaccard’s coefficient (JC) (Rijsbergen, 1979), the ratio of the matching words in x and y to all the words in x and y:
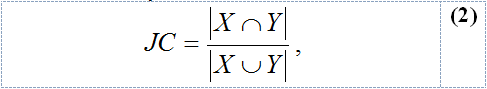
where X is the set of words of the string x and Y the set of words of y.
In order to compare the above-mentioned measures, we need the JC subtracted from one (1 – JC). Besides, the LD, IDWP, and MIDWP are divided by the length of the longest string. Thus, all the measures obtain a similarity value from 0 (x and y are the same string) to 1 (x and y are totally different).
Finally, we also combine the four previous similarity measures (combined similarity measure, CSM): we choose the minimum of the four similarity measures for every pair of strings.
4.3 Algorithm
The goal of clustering is to find similarity between strings and cluster them together based on a threshold of similarity between the strings.
In previous works ((French, 1997a), (French, 1997b), (Luján-Mora, 2000b)), the clustering algorithm employed is basically the leader algorithm (Hartigan, 1975). This algorithm is chosen as opposed to more elaborate algorithms (e.g. k-means algorithm, Fisher algorithm) because they are slower and the number of clusters is unknown. The leader algorithm is very fast, requiring only one pass through the data, but it has several negative properties: the partition is not invariant under reordering of the cases, the first clusters are always larger than the later ones and the final number of clusters depends on the threshold values. This is due to the very algorithm: the comparison between a new string and the existing clusters is made only until a cluster that meets the condition is found, without considering the possibility that a better value of the criteria is met later, for another cluster.
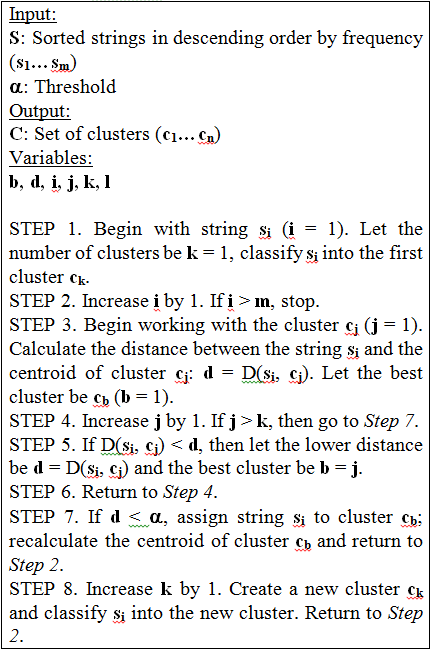
The clustering algorithm we propose in Table 1 resolves the previous problem: it uses a centroid method and the comparison for every string is made with all the existing clusters for the time being.
The algorithm chooses the strings, from greater to smaller frequency of appearance, since it assumes that the most frequent strings have a greater probability of being correct, and thus, they are taken as being representative of the rest. As seen in Table 1, it depends on one parameter ? (threshold). The algorithm makes one pass through the strings, assigning each string to the cluster whose centroid is closer and close enough (distance between the string and the centroid lower than ?) and making a new cluster for cases that are not close enough to any existing centroid. The distance D is calculated using one of the similarity measures explained in Section 4.2.
The centroid of a cluster must be recalculated every time a new string is assigned to the cluster. The centroid is chosen to minimise the sum-of-squares criterion:
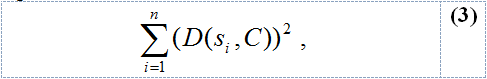
where n is the number of strings assigned to the cluster and C is the centroid of the cluster.
4.4 Revision and Updating
The final step of the method consists of checking the obtained clusters and detecting possible errors to correct them. In the original database, the strings of a cluster are replaced by its centroid (it represents its cluster). Therefore, all variants of a term are put together under a single form. Thus, in searches, data calculations and decision processes, final users will be confident that they have located all values relating to the required term.
5 EXPERIMENTAL RESULTS AND EVALUATION
We have used three files for evaluating our method. They contain data from three different databases with inconsistency problems: files A and B contain information in Spanish, while file C in English.
The method has been implemented in C and C++, running in Linux.
5.1 File Descriptions
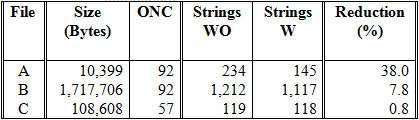
Table 2 gives a description of these three files. The optimal number of clusters (ONC) indicates the number of handcrafted clusters. The three last columns contain the number of single strings (not duplicated) with and without the expansion of abbreviations, and the rate of reduction (on expanding the abbreviations, the number of single strings is reduced, since duplicates are removed). We have done all the tests with (W) and without (WO) expansion of abbreviations.
We have developed a coefficient (consistency index) that permits the evaluation of the complexity of a cluster: the greater the value of the coefficient is, the more different the strings that form the cluster are. A null value indicates that the cluster contains only one string. The consistency index (CI) of a cluster of n strings is defined as:
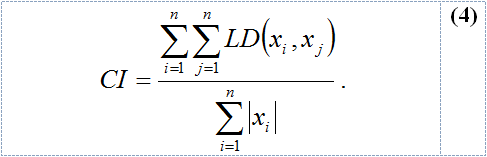
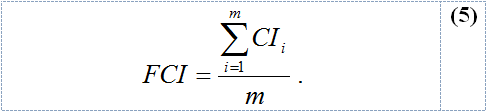
The file consistency index (FCI) of a file that contains m clusters is defined as the average of the consistency indexes of all the existing clusters in the file:
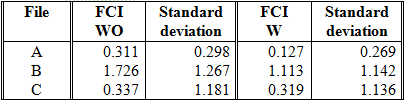
The FCI of the files A, B and C are shown in Table 3. As the FCI is an average, the table also shows the standard deviation. It is obvious that the clusters of file B are more complex than those of file A and C. In all cases, however, the FCI is reduced when expanding the abbreviations, since the discrepancies between the strings of a given cluster tend to diminish. With respect to file C, the reduction of FCI when the abbreviations are expanded is minimum, because the reduction of strings is not appreciable: only 0.8% versus 38.0% (file A) and 7.8% (file B), as it is shown in Table 2.
5.2 Evaluation Measures
We have evaluated the quality of the produced clusters when our method is applied by using four measures that are obtained by comparing the clusters produced by our method with the optimal clusters:
- NC: number of clusters. Clusters that have been generated.
- NCC: number of completely correct clusters. Clusters that coincide with the optimal ones: they contain the same strings. From this measure, we obtain Precision: NCC divided by ONC.
- NIC: number of incorrect clusters. Clusters that contain an erroneous string. From this measure, we obtain the Error: NIC divided by ONC.
- NES: number of erroneous strings. Strings incorrectly clustered.
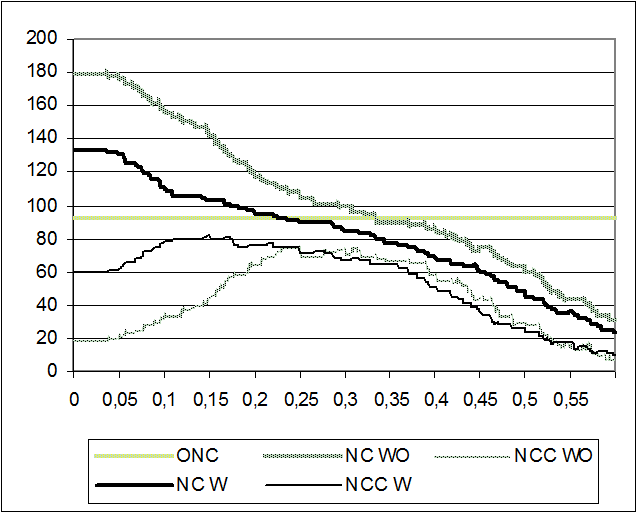
NC and NCC versus Threshold for File A with (W) and without (WO) expansion of abbreviations, using the CSM, are plotted in Figure 1. The expansion of abbreviations diminishes NC and increases NCC.
5.3 Evaluation and Discussion
As we have already mentioned, the clustering algorithm depends on one parameter (?). We have done all the tests on setting its value from 0.0 to 0.599, in 0.001 steps.
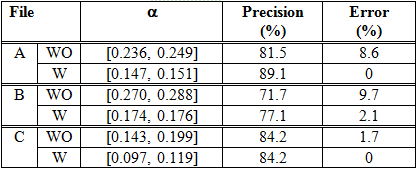
We compare the performance of the five similarity measures. The result of the experiments using files A and C are shown in Tables 4, 5, 6 and 7. The tables show the highest precision rate and the corresponding error obtained in each file when the LD, IDWP, MIDWP and JC are used. The corresponding threshold (?) also appears.
Note that the expansion of abbreviations improves the precision and diminishes the error. Moreover, the best precision, with a lower error, is obtained at a lower threshold.
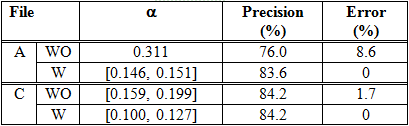
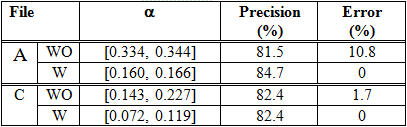
As you can see in Table 6, File A obtains the higher precision (89.1%) when the MIDWP with the expansion of abbreviations is employed. However, as seen in Table 7, File C obtains it (89.4%) when the JC without the expansion of abbreviations is used.
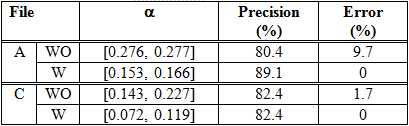
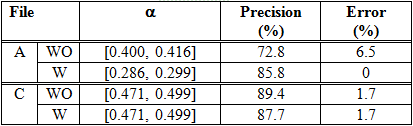
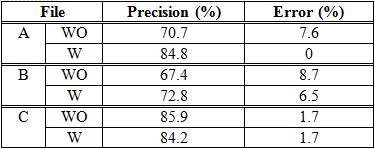
Table 8 shows highest precision and the corresponding error obtained for files A, B, and C when the CSM is employed. Files A and C have better precision than file B because their clusters are less complex: files A and C have a FCI around 0.3, whereas file B has a FCI of 1.7 (WO) and 1.1 (W).
In Table 9, we show the precision and error obtained in our previous works (Luján-Mora, 2000b). The test files A, B and C are the same of this paper. If this table is compared to Table 8, you can see the new method achieves better results: the precision increases and the error keeps very similar values or even diminish.
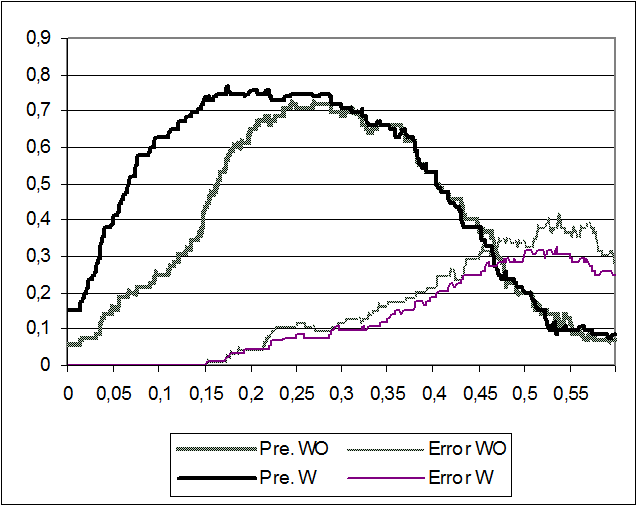
We compare the effect of the expansion of abbreviations in Figure 2. It shows Precision versus Threshold for File A with (W) and without (WO) expansion of abbreviations using the CSM. It is seen that the expansion of abbreviations produces the maximum precision (90%) at a threshold of 0.15. From a threshold of 0.25, the expansion of abbreviations does not influence the precision as observed in the figure.
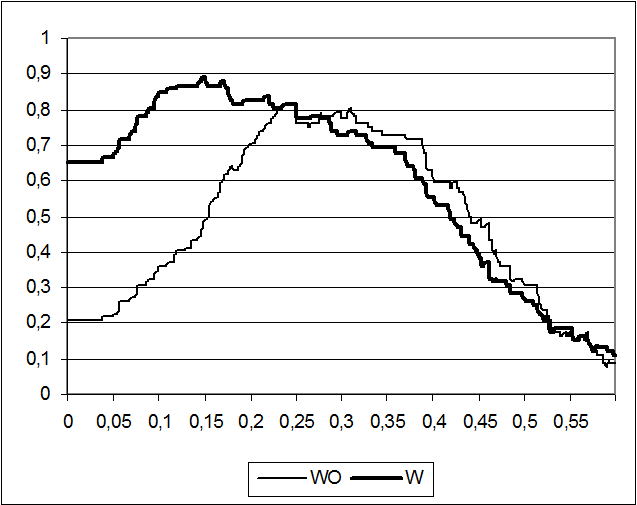
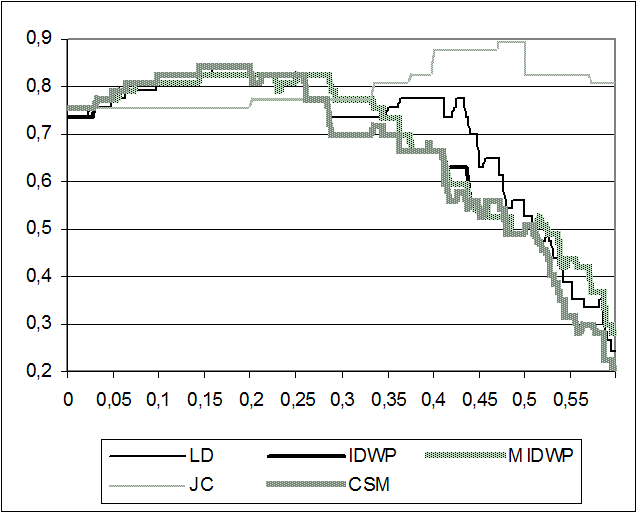
Figure 3 shows Precision versus Threshold for File C without expansion of abbreviations using different similarity measures. The JC obtains the maximum value (90%). All the measures, except the JC, have a similar behaviour: they start at the same level (75%), rise until 85% and then plunge until 20%. However, the JC remains steady over 75% for all the threshold values.
Finally, from Figure 4 it can be again seen that the expansion of abbreviations influences the precision at a low threshold, but from a threshold of 0.25, the influence is imperceptible (the behaviour is very similar to Figure 2). Also, note that there is not error when the threshold is lower than 0.15.
6 CONCLUSIONS AND WORK IN PROGRESS
In a DW, data is gathered from a variety of different sources. Removing errors and inconsistencies from data being imported into a DW is critical, because incorrect data will have a negative impact on the effective use of this data.
This paper has discussed techniques for improving data quality by clustering different values that refer to the same term and replacing them with a unique form. Therefore, we have presented an automatic method for reducing on the inconsistency found in existing databases. The method we have proposed achieves successful results with a considerably low error rate, although it does no eliminate the need to review the clusters obtained.
The expansion of abbreviations improves on the results in most cases, but we have detected some cases in which it actually makes the results worse. In addition, we have seen that the combined use of four similarity measures (Levenshtein distance, invariant distance from word position, modified IDWP, and Jaccard’s coefficient) normally obtains the best performance.
The final number of clusters strongly depends on the threshold value fixed by the user. A very small threshold (conservative) will produce a large number of small clusters, meanwhile a very large (aggressive) one will produce a small number of large clusters. Based on the data obtained in our research, we propose the use of a threshold between 0.1 and 0.25.
We are currently developing a graphical user interface to allow the user to control the data cleaning activity through parameters and a spreadsheet-like interface. As the proposed method is time-consuming, we are also considering to evaluate the impact of removing stop words (conjunctions, prepositions, articles and so on: words that contain little meaning) both in precision and time.
ACKNOWLEDGMENTS
We would like to thank Juan Carlos Trujillo for helpful comments and support in the final version of the paper.
REFERENCES
- Chaudhuri, S., and Dayal, U., 1997, “An Overview of Data Warehousing and OLAP Technology”, ACM Sigmod Record, 26(1), pages 65-74.
- French, J.C., et al, 1997a, “Automating the Construction of Authority Files in Digital Libraries: A Case Study”. In Peters, C., and Thanos, C., editors, Proceedings of the First European Conference on Research and Advanced Technology for Digital Libraries (ECDL 1997), September, Pisa (Italy), pages 55-71.
- French, J.C, Powell, A.L., and Schulman, E., 1997b, “Applications of Approximate Word Matching in Information Retrieval”. In Golshani, F., Makki, K., editors, Proceedings of the Sixth International Conference on Information and Knowledge Management (CIKM 1997), November, Las Vegas (USA), pages 9-15.
- Hartigan, J.A., 1975, Clustering Algorithms, New York (USA): John Wiley & Sons. Hernández, M.A., and Stolfo, S.J., 1998, “Real-world data is dirty: Data cleansing and the merge/purge problem”, Journal of Data Mining and Knowledge Discovery, 2(1), pages 9-37.
- Hirschberg, D.S., 1997, “Serial Computations of Levenshtein Distances”. In Apostolico, A., and Galil, Z., editors, Pattern Matching Algorithms, Oxford University Press.
- Inmon, W.H., 1990, Building the Data Warehouse, New York (USA): John Wiley & Sons.
- Levenshtein, V.I., 1966, “Binary codes capable of correcting deletions, insertions, and reversals”, Cybernetics and Control Theory, 10, pages 707-710.
- Luján-Mora, S., 2000a, “An Algorithm for Computing the Invariant Distance from Word Position”, [Internet], June. Available from: http://www.dlsi.ua.es/~slujan/ files/idwp.ps.
- Luján-Mora, S., and Palomar, M., 2000b, “Clustering of Similar Values, in Spanish, for the Improvement of Search Systems”. In Monard, M.C., and Sichman, J.S., editors, IBERAMIA-SBIA 2000 Open Discussion Track Proceedings, November, Sao Paulo (Brazil), pages 217-226.
- Monge, A.E., and Elkan, C.P., 1997, “An efficient domain-independent algorithm for detecting approximately duplicate database records”. In SIGMOD Workshop on Research Issues on Data Mining and Knowledge Discovery (DMKD’97), pages 23-29.
- Motro, A., and Rakov, I., 1998, “Estimating the Quality of Databases”. In Andreasen, T., Chistiansen, H., and Larsen, H.L., editors, Proceedings of FQAS 98: Third International Conference on Flexible Query Answering Systems, Lecture Notes in Artificial Intelligence, vol. 1495, Springer-Verlag.
- O’Neill, E.T., and Vizine-Goetz, D., 1988, “Quality Control in Online Databases”, Annual Review of Information Science and Technology, 23, pages 125-156.
- O'Neill, E.T., and Vizine-Goetz, D., 1989, “The Impact of Spelling Errors on Databases and Indexes”. In National Online Meeting Proceedings, May, New York (USA), pages 313-320.
- Rahm, E., and Do, H., 2000, Data Cleaning: Problems and Current Approaches, IEEE Bulletin of the Technical Committee on Data Engineering, 23(14).
- Rijsbergen, C.J. van, 1979, Information Retrieval, London (UK): Butterworhs.