Reducing Inconsistency in Integrating Data from Different Sources
Sergio Luján-Mora, Manuel Palomar
Proceedings 2001 International Database Engineering and Applications Symposium (IDEAS 2001), p. 209-218: IEEE Computer Society, Grenoble (France), July 16-18 2001. https://doi.org/10.1109/IDEAS.2001.938087
(IDEAS'2001)
Congreso internacional / International conference
Resumen
One of the main problems in integrating databases into a common repository is the possible inconsistency of the values stored in them, i.e., the very same term may have different values, due to misspelling, a permuted word order, spelling variants and so on. In this paper, we present an automatic method for reducing inconsistency found in existing databases, and thus, improving data quality. All the values that refer to a same term are clustered by measuring their degree of similarity. The clustered values can be assigned to a common value that, in principle, could be substituted for the original values. We evaluate four different similarity measures for clustering with and without expansion of abbreviations. The method we propose may work well in practice but it is time-consuming. In order to reduce this problem, we remove stop words for speeding up the clustering.
Descarga
Texto completo
1 Introduction
Information fusion is the process of integration and interpretation of data from different sources in order to derive information of a new quality. Integrating databases into a common repository has become a research topic for many years. Information fusion is a very complex problem, and is relevant in several fields, such as Data Re-engineering, Data Warehouse, Web Information Systems, E-commerce, Scientific Databases, etc. The problem of inconsistency has also lately been a focus of interest in the area of Data warehouses (DW) as a DW is a repository of integrated information from distributed, autonomous, and possibly heteroge-neous. sources.
Traditional search systems work by matching the term that is being searched with the values stored in the corresponding database. If the information contained in databases is inconsistent (i.e., if a given term appears with different values because several denominations exist, or because it is misspelled), a search using a given value will not provide all the available information about the term. On the other hand, DW are used for decision making, and incorrect or misleading data will produce wrong business decisions.
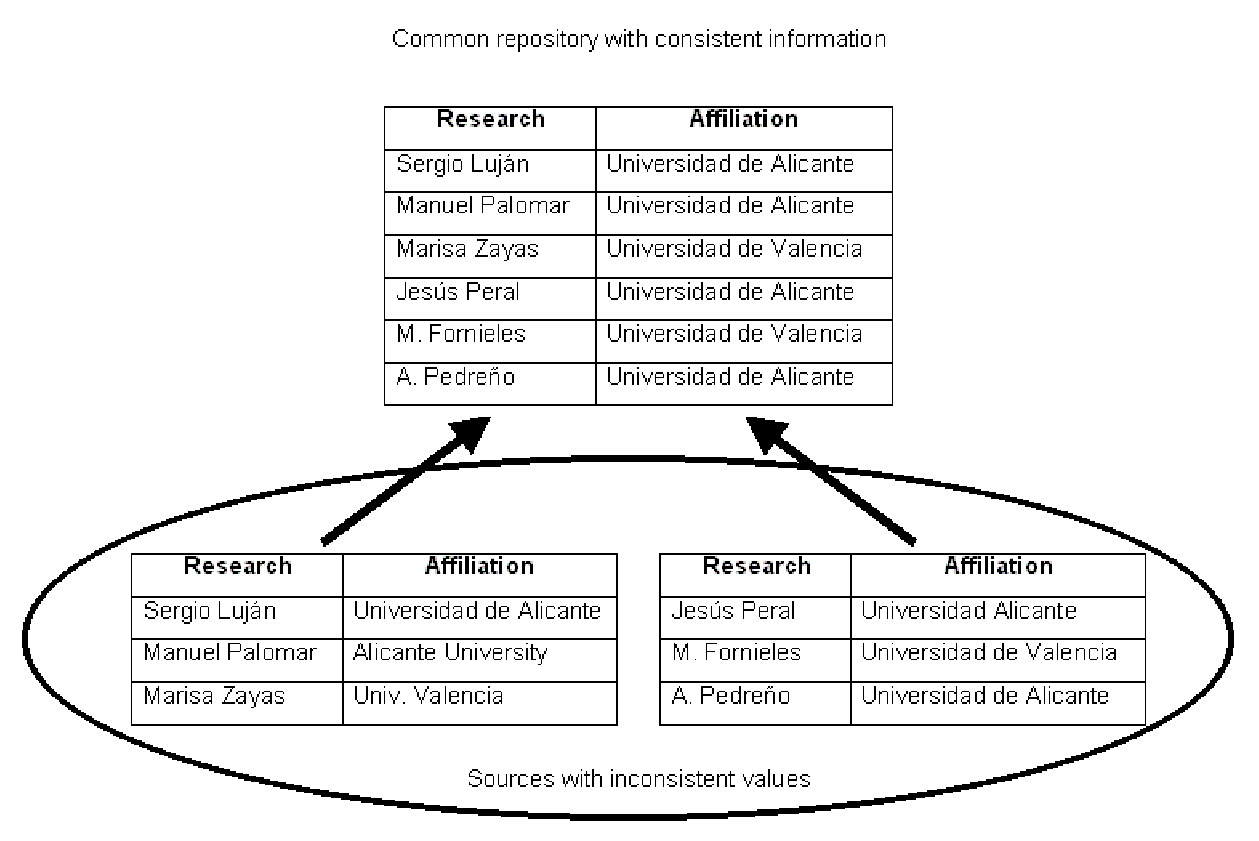
In Figure 1, we present an example to show the aim of our proposal. Let us suppose that we have different databases (particularly, different relational tables) and the sources have different criteria for representing values in affiliation names. For example, with reference to the affiliation of researchers who work at the University of Alicante, we may easily find that there are different values for this university: “Universidad de Alicante” or “Universidad Alicante” (in Spanish) and “Alicante University” (in English).
Data cleaning, also called data cleansing or scrubbing, deals with detecting and removing errors and inconsistencies from data in order to improve the. quality of data [19]. Rahm distinguish between “single-source and multi-source problems and between schema-and instance-related problems” Our paper discusses the problem of the inconsistency found in the values stored in databases (instance level, i.e., data values, not attribute names). We have detected two principal causes:
- Single-source: If the number of possible values that a single field can accept is not controlled, a given person, (or different persons), may insert the same term with different values. For instance, a database that stores the names of the departments of a university may have several different forms (e.g., the use of upper-case letters or abbreviations): “Departamento de Lenguajes y Sistemas lnformdticos”, “Depto. de Lenguajes y Sistemas Informdticos”, “Dpt. de lenguajes y sistemas informdticos”, etc.
Another problem is the multilinguality. In a multilingual society (e.g., European Community) it is common to find official names written in different languages. For instance, we consult a database that stores information about university researchers, (e.g., researcher's name, researcher's university, etc.), and we wish to obtain a list of all of the researchers who work at the University of Alicante. We may easily find that there are different values for this university: “Universidad de Alicante” (in Spanish), “Universitat d'Alacant” (in Catalan), ”University of Alicante” or “Alicante University” (in English), and “Université d'Alicante” (in French). - Multi-source: When we try to integrate different databases into a common repository (e.g., in a DW), one or more of them may suffer from the abovementioned problem. The consistency of their contents might have been guaranteed separately. However, the criteria used for establishing the consistency of each one might well be different and integrating them all could cause inconsistency problems. For example, we wish to integrate three different databases that store bibliographical information. The authors might well appear in different forms in each one: e.g., full names, “Miguel de Cervantes Saavedra”, or by last names first and then the first name, “Cervantes Saavedra, Miguel de”, or by first name and last name only, “Miguel de Cervantes”.
The remainder of the paper is structured as follows: Section 2 outlines the origin of the problem and the possible causes that give rise to the different variants that appear for the same term; Section 3 introduces our method for reducing inconsistency found in existing databases; Section 4 explains the core of our study and details the technical as-pects of our method; Section 5 provides an evaluation of the method; and finally, our conclusions and work in progress are presented in Section 6.
2 Analysis of the Problem
After analysing several databases with information both in Spanish and in English, we have noticed that the different values that appear for a given term are due to a combination of the following eleven causes (lexical discrepancies):
- The omission or inclusion of the written accent: “Asociacion Astronómica” or “Asociacion Astronomica”.
- The use of upper-case and lower-case letters: “Department of Software and Computing Systems” or ”Department of software and computing systems”.
- The use of abbreviations and acronyms: “Department of Software, University of Alicante” or “Dep. of Software, Univ. Alicante”.
- Word order: “Miguel de Cervantes Saavedra” or “Cervantes Saavedra, Miguel de”.
- Different transliterations: “Kolmogorov” or “Kolmogorof”, “Chebyshev” or “Tchebysheff”.
- Punctuation marks (e.g., hyphens, commas, semicolons, brackets, exclamation marks, etc.): “Laboratorio Multimedia (mmlab)” or “Laboratorio Multimedia - mmlab”.
- Errors: Misspelling (apart from the written accent), typing or printing errors (absence of a character, interchange of adjacent characters, etc.), phonetic errors: “Gabinete de imagen” or “Gavinete de imagen”, “Bill Clinton” or “Bill Klinton”.
- Numbers: “Area 51” or “Area fifty-one”.
- Extra words: “Royal Yacht Club” or “Yacht Club”.
- Different denominations and synonyms: “Seismological Register Unit” or “Seismic Register Unit”.
- Use of different languages: “Tribunal de Cuentas” (Spanish), or “Court of Auditors” (English) or “La Cour des Comptes (French).
There has been great interest in studying the quality of the information stored in databases for a long time [15], [16], [17], [18], and diverse methods have been developed for data cleaning [1], [5], [6], [13], [14], [19] and, in particular, for the reduction of the inconsistency found in databases [2], [3], [11], [10], [12].
3 Intuitive Proposal of a Method to Reduce the Inconsistency Found in Databases
The method we propose in this paper improves our previous work [11], [10], [12] that were developed from French's automatic creation of authority files for bibliographical catalogues [2], [3]. We have added new distances, developed different evaluation measures and employed a different clustering algorithm. These improvements result in a better performance of the method.
Our algorithm resolves all the problems detailed in Section 2, except the four last causes, which depend on how different the two strings that represent the same term arc. The method that we propose can be divided into six steps [11] (the improvements presented in this paper affect the second and fourth step):
- Preparation. It may be necessary to prepare the strings before applying the clustering algorithm.
-
Reading. The following process is repeated for each of the strings contained in the input file:
- Read a string.
- Expand abbreviations andacronyms.
- Remove accents: e.g., A substitutes A´ and A, and a substitutes a´ and a`.
- Shift string to lower-case.
- Remove stop words.
- Store the string: If it has been stored previously, its frequency of appearance is increased by one unit.
- Sorting. The strings are sorted, in descending order, by frequency of appearance.
- Clustering. The most frequent string is chosen and it is compared to the rest of the strings, using a measure of similarity. This process is repeated, successively, until all the strings have been clustered.
- Checking. The resulting clusters are verified and the possible errors are located and corrected.
- Updating. The original database is updated. The strings of a cluster are replaced by its centroid.
4 Technical Description of the Method
In this section. technical aspects of our method are de-scribed. We start by introducing a pre-processing for obtaining better results in Section 4.1. Section 4.2 describes how the similarity between two strings is considered. Section 4.3 presents the algorithm itself and finally, Section 4.4 explains the last step of the method, i.e., checking that the obtained clusters are correct.
4.1 Pre-processing
The strings undergo a pre-processing to obtain better results from’ the clustering. The objective of this preprocessing is to avoid the three first causes of the appearance of different forms for the same term (see Section 2): i.e., accents, lower-case/upper-case and abbreviations. The accents are eliminated, the string is converted to lower-case and the abbreviations are expanded.
For identifying and expanding abbreviations, we use a dictionary of abbreviations to look up an abbreviation and provide an expansion. Obviously, this method is not perfect and it does not avoid getting a wrong answer in ambiguous cases (looking up something that is not really an abbreviation, or not looking up something that is).
Furthermore, the stop words are removed from strings. This is done by comparing the input string with a stop list of words which are to be removed. The list of stop words include closed-class words such as articles, prepositions, con-junctions, etc., together with auxiliary words and common words with little meaning. Obviously, every language has a different stop list.
4.2 String Similarity
The Similarity between any two strings must be evalu-ated. There are several similarity measures; in our previous work [11], [10], [12], we have employed five measures: Levenshtein distance (LD), invariant distance from word position (IDWP), a modified version of the previous distance (MIDWP), Jaccard's coefficient (JC), and the minimum of the four previous measures (CSM). In our previos research; we have carried out many experiments and the LD bas-at-tained the worst results. Because. of that, we have only used the remaining similarity measures in the experiments presented in this paper.
The edit distance or Levenshtein distance (LD) [8] has been traditionally used in approximate-string searching and spelling-error detection and correction. The LD of strings, x and y is defined as the minimal number of simple editing operations that are-required to transform x into y. The simple editing-operations considered are: insert a character, delete of a character, and substitute a character with another. - In our method, we have taken a unitary cost function for all the operations and for all of the characters. The LD of two strings m and n in length, respectively, can be calculated by a dynamic programming algorithm [7]. The algorithm requires θ(mn) time and space.
If two strings contain the same words (variant forms of the same. term) but with a permuted word order, the LD will not permit their clustering. To solve this problem, we introduce another distance that we call the invariant distance from word position (IDWP) [9]. It is based on the 'approximate word matching referred to in [2], [3]. To calculate the IDWP of two strings, they are broken up into words (we consider’ a word to be any succession of digits and letters of the Spanish alphabet). The idea.is to pair off the words so that the sum of the LD is minimised. If the strings contain different numbers of-words, the cost of each unpaired word is the length of the word.
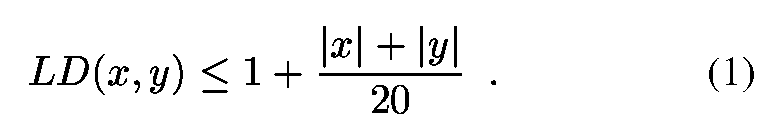
We also use a modified IDWP (MIDWP). We add a new matching condition: if two strings fulfil Equation 1, we assume they match perfectly(in that case, we consider their LD is zero):
The last similarity measure we have employed is the Jac-card's coefficient (JC) [20], the ratio of the matching words in x and y to all the words in x and y:
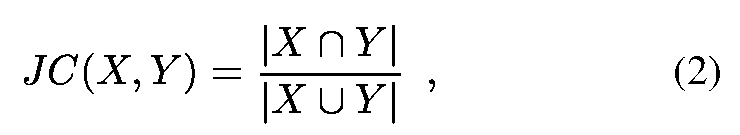
where X is the set of words of the string x and Y the set of words of y.
In order to compare the above-mentioned measures, we need the Ie subtracted from one (1 - JC). Besides, the LD, IDWP, and MIDWP are divided by the length of the longest string. Thus, all the measures obtain a similarity value from 0 (x and y are the same string) to 1 ((x and y are totally different).
Finally, we also combine the four previous similarity measures (combined similarity measure, CSM): we choose the minimum of the four similarity measures for every pair. of strings.
4.3 Algorithm
The goal of clustering is to find similarity-between - strings - and cluster them together based on a threshold of similarity between the strings. Inrelated work [2], [3], [11], the clustering algorithm employed is basically the leader algorithm [4]. This algorithm is chosen as opposed to more elaborate algorithms (e.g., k-means.algorithm, Fisher algorithm) because the more elaborate algorithms are slower and the number of clusters is unknown. The-leader algorithm is very fast, requiring only one. pass-through the data, but it has several negative properties; the partition is not invariant under reordering of the cases and the first clusters are always larger than the Iater ones. This is intrinsic to the algorithm: the comparison between a new string and the existing clusters is made only until a cluster ‘that meets’ the condition is found, without considering the possibility that a better value of the criteria is met later, for another cluster.
The clustering algorithm we propose in Figure 2 resolves the first-clusters-larger problem: it uses a centroid method and the comparison for-every-string is made with all the existinz clusters for the time being.
The algorithm chooses the strings, from greatest to smallest frequency of appearance, since it assumes that the most. frequent strings have a. greater-probability of being-correct, and thus, they are taken as being representative of the rest. As seen in Figure. 2 it depends on one parameter a (threshold). The algorithm makes one pass through - the strings, assigning each string to the cluster whose centroid is closer and close enough (distance between the string and the centroid lower than α) and making a new cluster for cases that are not close enough to any existing centroid. The distance D is calculated using one of the similarity measures explained in Section 4.2.

The centroid of a cluster must be recalculated every time a new string is assigned to the cluster. The centroid is chosen to minimise the sum-of-squares criterion (this value is used as a quality measure of the centroid):
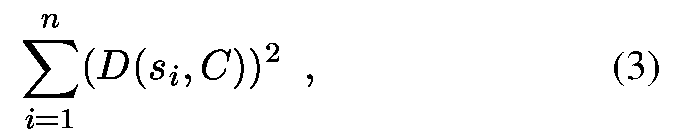
where n is the number of strings assigned to the cluster and C is the centroid of the cluster.
4.4 Revision and Updating
The final step of the method consists of visual checking the obtained clusters and detecting possible errors to correct them (the method achieves successful results, although it does not eliminate the utility of reviewing the clusters ob-tained). In the original database, the strings ora cluster are replaced by its centroid (it represents its cluster). Therefore, almost all variants of a term are put together under a single form.
5 Experimental Results and Evaluation
We have used four files for evaluating our method. They contain data from four different databases with inconsistency problems: files A, B, and D contain information in Spanish, while file C in English. The method has been implemented in C and C++, running in Linux.
5.1 File Descriptions
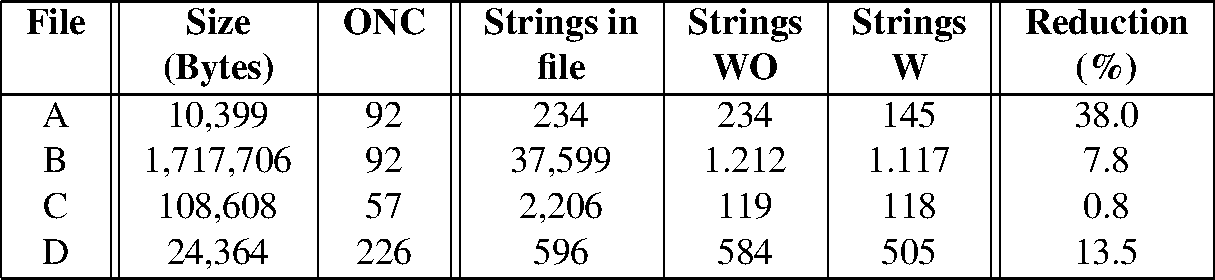
TABLE 1 gives a description of these four files. The optimal number of clusters (ONC) indicates the number of handcrafted clusters. The three last columns contain the number of single strings with (W) and without (WO) the expansion of abbreviations, and the rate of reduction (on expanding the abbreviations, the number of single strings is reduced, since duplicates are removed). We have done all the tests with and without the expansion of abbreviations.
The amount of duplication of a file is measured by the duplication factor (DF) [1], which indicates how many duplicates (textual or not textual) of each record appear in the file, on the average. Table 2 shows the DF and the standard deviation (SD) of the four files. It also shows the reduction (Red.) of the DF when the abbreviations are expanded.

The DF shows how many duplicates of each record exist, but it does not indicates if the duplicates look like each other or not. We have developed a coefficient (consistency index) that permits the evaluation of the complexity of a cluster: the greater the value of the coefficient is, the more different the strings that form the cluster are. A null value indicates that the cluster contains only one string. The consistency index (CI) of a cluster of n strings is defined as:
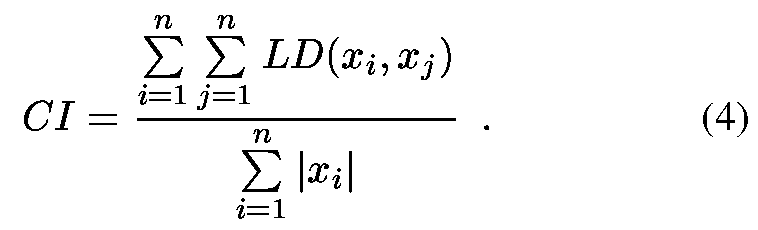
The file consistency index (FCI) of a file that contains m clusters is defined as the average of the consistency indexes of all the existing clusters in the file:
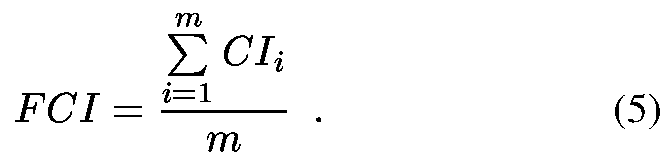
The FCI for hand-generated clusters of the files A, B, C, and D is shown in Table 2. As the FCI is an average, the table also shows the standard deviation (SD). It is obvious ‘that the clusters of file B are more complex than those’ of files A, C, and D. In all cases, however, the FCI is reduced when expanding. the abbreviations, since the discrepancies between the strings of a given cluster tend to diminish. With respect to file C, the reduction of FCI when the abbreviations are expanded is minimum, because the reduction of strings is not appreciable: only 0.8% versus 38.0% (file A), 7.8% (file B), and 13.5% (file D) as it is shown in Table 1.
5.2 Evaluation Measures
We have evaluated the quality of the produced clusters when our method is applied by using four measures that are obtained by comparing the clusters produced by our method with the optimal clusters (ONC):
- NC: number of clusters. Clusters that have been generated.
- Nee: number of completely correct clusters. Clusters that coincide with the optimal ones: they contain the same strings. From this measure, we obtain Precision: Nee divided by ONC.
- NIC: number of incorrect clusters. Clusters that contain an erroneous string. From this measure, we obtain the Error: NIC divided by ONC.
- NES: number of erroneous strings. Strings incorrectly clustered.
5.3 Evaluation and Discussion
Here we study the effectiveness of our method on real data. As we have already mentioned, the clustering algorithm depends on one parameter (α). We have done all the tests on setting its value from 0.0 to 0.599, in 0.001 steps.
We compare the performance of the four similarity measures: invariant distance from word position (IDWP), modified IDWP (MIDWP), Jaccard's coefficient (JC); and combined similarity measure (CSM). The result of the experiments using the four files and removing stop words are shown in Tables 3, 4, 5, and 6. The tables show the highest precision rate and the corresponding error obtained in each file without (WO) and with (W) the expansion of abbreviations. The corresponding threshold (α) also appears.

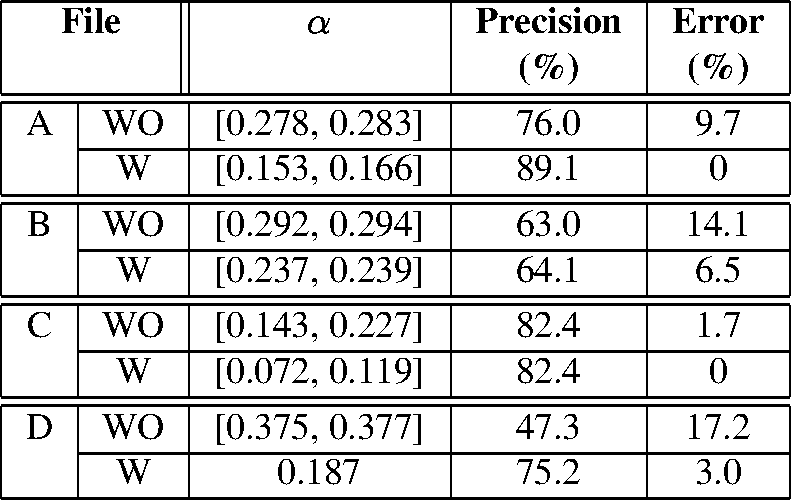
Note that the expansion of abbreviations improves the precision and diminishes the error in all cases (except file C). Besides, the best precision, with a lower error, is obtained at a lower threshold when the abbreviations are expanded.
As you can see in Tables 3, 4, 6 the highest precision is obtained for a threshold between 0.1 and 0.3. However, the JC (Table 5) needs a threshold near 0.5 for the highest precision.
On the other hand, as you can see in Table 6, File A and B obtain the best precision (89.1% and 76.0% respectively) when the CSM with the expansion of abbreviations. is employed. However, as seen in Table 5, File C obtains it (85.9%) when the JC without the expansion of abbreviations is used. Finally, File D obtains the best precision (75.2%) with the MIDWP (Table 4) and the expansion of abbreviations. The similarity measure that produces the best results varies from a file to another.
In Table 7 (column Previous work), we show the highest precision an error obtained in our previous work (without removing stop words) [10], [12]. The corresponding threshold (α) also appears. The test files A, B, C, and D are the same as in this paper.

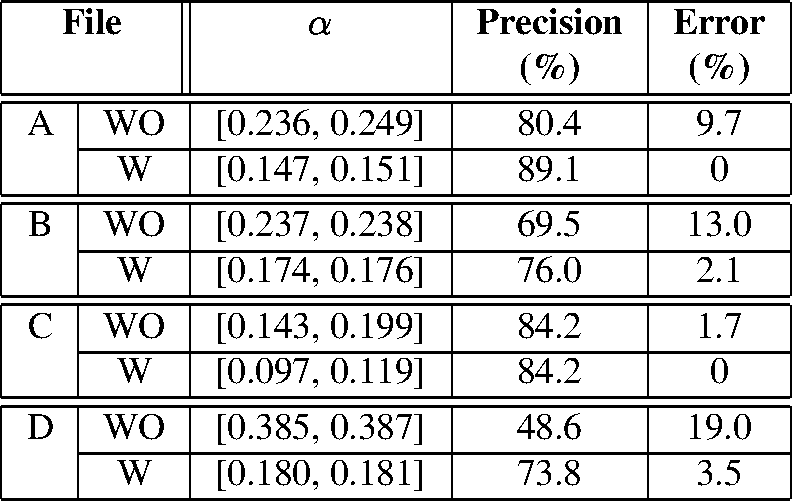
Table 7 also summarizes Tables 3, 4, 5, and 6 (column Current work). files A and C have better precision than files Band D because their clusters are less complex (see DF and FCI in Table 2). Surprisingly, removing stop words does not improve clustering quality. Moreover, the precision diminishes even 4 units in some cases.

Figures 3 and 4 compare precision and error obtained in our previous and current work, The left graph in Figure 3 shows the dependency of precision from the threshold (α) for all four files when the combined similarity measure (CSM), with expansion of abbreviations, and without removing stop words is applied (the graph obtained without expansion of abbreviations is very similar to this one). The four curves (files) have a similar shape, with a peak between 0.1 and 0.25.
Figure 3 also shows the effect of varying the threshold (α) in the error, The, right graph compares the error, for all four files when the combined similarity measure (CSM) with expansion of abbreviations is applied. The error is insignificant when the threshold is under 0.15. For a threshold under 0.35, the error is below 15%.

Finally, Figure 4 displays precision (left) and error (right) achieved with' thc combined similarity measure (CSM) and expansion of abbreviations, The shape of these two graphs is very similar to Figure 3: the precision keeps very similar and the error increases slightly for a threshold greater than 0.3. When the results obtained ‘with the other’ similarity measures (IDWP, MIDWP, and JC) are plotted, the graphs also present a similar shape.

The threshold that obtains the best precision is certainly difficult to determine, because it varies from a data set to another one. But Table 7 and Figures 3 and 4 insinuate a value between 0.1 and 0.3.
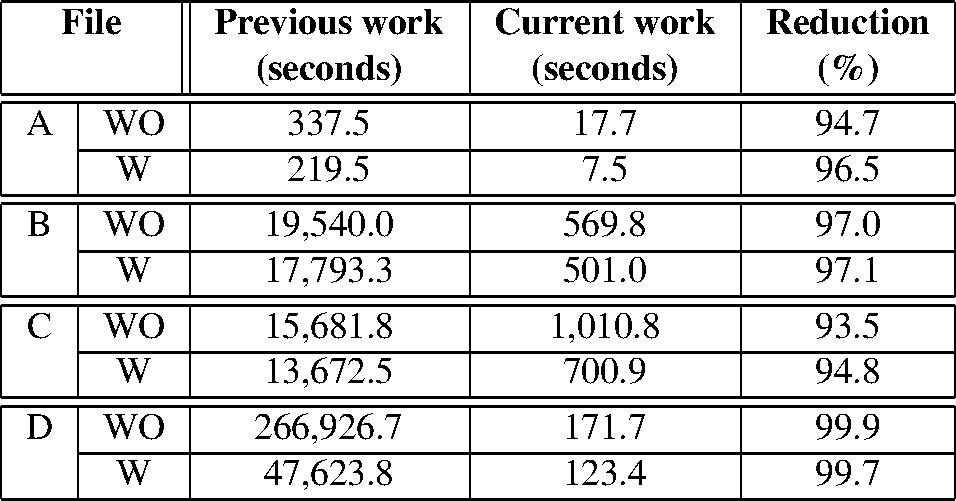
Table 8 shows a time comparison between previous work (without removing stop words) and current work (removing stop words). Notice that in all cases, removing stop words speeds up the process, because the length of the strings di-minishes. Therefore, there are great time savings in removing stops words with a little impact in precision.
6 Conclusions and Future Work
Referential integrity provided by relational database management systems prevents users or applications from entering inconsistent data. Databases with an inadequate design may suffer data redundancy and inconsistency. On the other hand, there is an increasing need to integrate data and provide a uniform view of data. This paper has discussed techniques for improving data quality by using clustering to find different values that refer to the same term and replacing all values in a cluster with a unique form. So, we have presented an automatic method for reducing the inconsistency found in existing databases. Our method clusters strings based on their proximity to the existing clusters: the distance between a cluster and a string is determined as the difference between the centroid of the cluster and the string.
The method. we have proposed achieves successful results with a considerably low error rate, although it does not eliminate the utility of reviewing the clusters obtained. On the other hand, the method is time-consuming. We remove stop words for speeding up the clustering, but the precision only diminishes slightly.
The final number of clusters and the effectiveness of the method strongly depends on the threshold value fixed by the user. The threshold lets the user adjust the behavior of the method: a very small threshold (conservative) will produce a large number of small clusters and a decrease in the number of matching values that should be clustered, meanwhile a very large (aggressive) one will produce a small number of large clusters and an increase in the number of falsely matched values. Based on the data obtained in our research, we propose the use of a threshold between 0.1 and 0.3.
Our first contribution is an algorithm that is domain-independent and language-independent. Previous related work deals with special cases of the field matching problem (customer addresses, census records, bibliographic databases, etc.). The second contribution is the use of two methods for evaluating the similarity between two strings: the invariant distance from word position, derived from the Levenshtein distance, and the combined similarity measure. Last but not least, we present the consistency index that - permits the evaluation of the complexity of a cluster: the greater the value of the coefficient is, the more different the strings that form the cluster are.
Currently, we are working on improving the algorithm in order to cluster the multilingual values. We are applying dictionaries and other techniques relating to natural language processing.
We are also planning to investigate other heterogeneity problems: record matching (merge/purge problem) and schema level conflicts (attribute naming conflicts, format heterogeneity, and so on).
Acknowledgments
We would like to thank Juan Carlos Trujillo for helpful comments. We also want to thank the anonymous reviewers for their comments which helped us to improve this paper.
References
- [1] D. Bitton and D. J. DeWitt. Duplicate record elimination in large data files. ACM Transactions on Database Systems, 8(2):255--265, June 1983.
- [2] J. C. French, A. L. Powell, and E. Schulman. Applications of Approximate Word Matching in Information Retrieval. In F. Golshani and K. Makki, editors, Proceedings of the Sixth International Conference on Information and Knowl edge Management (CIKM 1997), pages 9--15, Las Vegas (USA), November 1014 1997. ACM Press.
- [3] J. C. French, A. L. Powell, E. Schulman, and J. L. Pfaltz. Automating the Construction of Authority Files in Digi tal Libraries: A Case Study. In C. Peters and C. Thanos, editors, Proceedings of the First European Conference on Research and Advanced Technology for Digital Libraries (ECDL 1997), volume 1324 of Lecture Notes in Computer Science, pages 55--71, Pisa (Italy), September 13 1997. SpringerVerlag.
- [4] J. A. Hartigan. Clustering Algorithms. A Wiley Publication in Applied Statistics. John Wiley & Sons, New York (USA), 1975.
- [5] M. A. Hernández and S. J. Stolfo. The Merge/Purge Problem for Large Databases. In M. J. Carey and D. A. Schneider, ed itors, Proceedings of the 1995 ACM SIGMOD International Conference on Management of Data, pages 127--138, San Jose (USA), May 2225 1995. ACM Press. Also published as SIGMOD Record 24(2), June 1995.
- [6] M. A. Hernández and S. J. Stolfo. Realworld data is dirty: Data cleansing and the merge/purge problem. Journal of Data Mining and Knowledge Discovery, 2(1):9--37, 1998.
- [7] D. S. Hirschberg. Serial Computations of Levenshtein Dis tances. In A. Apostolico and Z. Galil, editors, Pattern Matching Algorithms, pages 123--141. Oxford University Press, New York (USA), 1997.
- [8] V. I. Levenshtein. Binary codes capable of correcting dele tions, insertions, and reversals. Cybernetics and Control Theory, 10:707--710, 1966.
- [9] S. LujánMora. An Algorithm for Computing the Invariant Distance from Word Position. Internet: http://www.dlsi.ua.es/~slujan/files/idwp.ps, June 2000.
- [10] S. LujánMora and E. Montenegro. Reducing Inconsistency in Data Warehouses. In International Conference on Enter prise Information Systems (ICEIS 2001), Setúbal (Portugal), 2001.
- [11] S. LujánMora and M. Palomar. Clustering of Similar Val ues, in Spanish, for the Improvement of Search Systems. In M. C. Monard and J. S. Sichman, editors, International Joint Conference IBERAMIASBIA 2000 Open Discussion Track Proceedings, pages 217--226, Atibaia, São Paulo (Brazil), November 1922 2000. ICMC/USP.
- [12] S. LujánMora and M. Palomar. Comparing String Simi larity Measures for Reducing Inconsistency in Integrating Data from Different Sources. In H. Lu, X. Wang, and G. Yu, editors, The Second International Conference on WebAge Information Management (WAIM2001), Lecture Notes in Computer Science, Xi'an (China), 2001. SpringerVerlag.
- [13] A. E. Monge and C. P. Elkan. The field matching problem: Algorithms and applications. In E. Simoudis, J. Han, and U. M. Fayyad, editors, Proceedings of the Second Interna tional Conference on Knowledge Discovery and Data Min ing (KDD 1996), pages 267--270, Portland (USA), August 1996. AAAI Press.
- [14] A. E. Monge and C. P. Elkan. An efficient domain independent algorithm for detecting approximately dupli cate database records. In SIGMOD Workshop on Re search Issues on Data Mining and Knowledge Discovery (DMKD'97), pages 23--29, Tucson (USA), May 11 1997.
- [15] A. Motro and I. Rakov. Estimating the Quality of Data in Relational Databases. In R. Y. Wang, editor, Proceedings of the 1996 Conference on Information Quality, pages 94--106, Cambridge (USA), Octubre 1996.
- [16] A. Motro and I. Rakov. Estimating the Quality of Databases. In T. Andreasen, H. Christiansen, and H. Larsen, edi tors, Proceedings of FQAS 98: Third International Confer ence on Flexible Query Answering Systems, volume 1495 of Lecture Notes in Artificial Intelligence, pages 298--307, Roskilde (Denmark), May 1998. SpringerVerlag.
- [17] E. T. O'Neill and D. VizineGoetz. Quality Control in On line Databases. In M. E. Williams, editor, Annual Review of Information Science and Technology (ARIST), volume 23, pages 125--156, New York (USA), 1988. Elsevier Science Publishers.
- [18] E. T. O'Neill and D. VizineGoetz. The Impact of Spelling Errors on Databases and Indexes. In C. Nixon and L. Pad gett, editors, 10th National Online Meeting Proceedings, pages 313--320, New York (USA), May 911 1989. Learned Information Inc.
- [19] E. Rahm and H. H. Do. Data Cleaning: Problems and Cur rent Approaches. IEEE Bulletin of the Technical Committee on Data Engineering, 23(4):3--13, December 2000. [20] C. J. V. Rijsbergen. Information Retrieval. Butterworths, London (UK), 2 edition, 1979.
- [20] C. J. V. Rijsbergen, Information Retrieval, Bunerworths, London (UK):, 1979.