Physical Modeling of Data Warehouses using UML
Sergio Luján-Mora, Juan Trujillo
Proceedings of the 7th ACM International Workshop on Data Warehousing and OLAP
(DOLAP 2004),
p. 48-57, Washington D.C. (USA), November 12-13 2004. https://doi.org/10.1145/1031763.1031772
(DOLAP'04)
Congreso internacional / International conference
Resumen
During the few last years, several approaches have been proposed to model different aspects of a Data Warehouse (DW), such as the conceptual model of the DW, the design of the ETL (Extraction, Transformation, Loading) processes, the derivation of the DW models from the enterprise data models, etc. At the end, a DW has to be deployed to a database environment and that takes many decisions of a physical nature. However, few efforts have been dedicated to the modeling of the physical design (i.e. the physical structures that will host data together with their corresponding implementations) of a DW from the early stages of a DW project. From our previously presented DW engineering process, in this paper we present our proposal for the modeling of the physical design of DWs by using the component diagrams and deployment diagrams of the Unified Modeling Language (UML). Our approach allows the designer to anticipate important physical design decisions that may reduce the overall development time of a DW such as replicating dimension tables, vertical and horizontal partitioning of a fact table, the use of particular servers for certain ETL processes and so on. Moreover, our approach allows the designer to cover all main design phases of DWs, from the conceptual modeling phase until the final implementation, as we show with an example in this paper.
Descarga
Texto completo
1. INTRODUCTION
The design of a Data Warehouse (DW) has been tackled mainly from the conceptual and logical point of view through multidimensional (MD) data models [3, 1], but to the best of our knowledge, there is not any standard method or model that allows us to model all aspects of a DW. Moreover, as most of the research efforts in designing and modeling DWs have been focused on the development of MD data models, the interest on the physical design of DWs has been very poor. Nevertheless, the physical design of a DW is of a vital importance and highly influences the overall performance of the DW [15] and the ulterior maintenance. In some organizations, the same employee may take on both the role of DW designer and DW administrator, but other organizations may have separate people working on each task. Regardless of the situation, modeling the storage of the data and how it will be deployed across different components (servers, drives, etc.) helps implementing and maintaining a DW. Due to the idiosyncrasy of DWs, we can adopt several decisions regarding the physical design from the early stages of a DW project (in which final users, analysts, designers, and administrators participate). We believe that taking early these decisions will normally reduce the total development time of the DW. It should be taken into consideration that we are not saying to accomplish the conceptual modeling of a DW taking into account physical issues, instead we argue to model physical aspects and ulterior implementations together with the conceptual modeling of the DW from the early stages of a DW project.
In previous works [9, 10], we have proposed a DW development method, based on the Unified Modeling Language (UML) [16] and the Unified Process (UP) [5], to properly design all aspects of a DW. Until now, we have dealt with the modeling of different aspects of a DW by using the UML [16]: MD modeling [20, 11, 12], modeling of the ETL processes [19], modeling data mappings between data sources and targets [13], etc. Following these works, we present in this paper a proposal to accomplish the physical design of DWs from early stages of a DW project. To accomplish this, we propose the use of the component diagrams and deployment diagrams of UML. Both component and deployment diagrams must be defined at the same time by DW designers and DW administrators who will be in charge of the ulterior implementation and maintenance. This is mainly due to the fact that, while the former know how to design and build a DW, the latter have a better knowledge in the corresponding implementation and the real hardware and software needs for the correct functioning of the DW.
The modeling of the physical design of a DW from the early stages of a DW project with our proposal provides us many advantages:
- We deal with important aspects of the implementation before we start with the implementation process, and therefore, we can reduce the total development time of the DW. This is mainly due to the fact that, after the conceptual modeling has been accomplished, we can have enough information to take some decisions regarding the implementation of the DW structures such as replicating dimension tables or making the vertical and horizontal partitioning of a fact table.
- We have a rapid feedback if we have a problem with the DW implementation as we can easily track a problem to find out its main reasons.
- It facilitates the communication between all people involved in the design of a DW since all of them use the same notation (based on UML) for modeling different aspects of a DW. Moreover, making sure that the crucial concepts mean the same to all groups and are not used in different ways is critical. In this way, our approach helps achieve a coherent and consistent documentation during the DW developing life cycle.
- It helps us choose both hardware and software on which we intend to implement the DW. This also allows us to compare and evaluate different configurations based on user requirements.
- It allows us to verify that all different parts of the DW(fact and dimension tables, ETL processes, OLAP tools, etc.) perfectly fit together.
The rest of the paper is organized as follows. In Section 2, we briefly comment other works that have dealt with the physical design and/or deployment of a DW. In Section 3, we briefly introduce our overall method to design all aspects of a DW. In Section 4, we present main issues that can be specified by using both component and deployment diagrams of UML. In Section 5, we describe our proposal for using both component and deployment diagrams for the physical design of DWs. Finally, in Section 6, we present our conclusions and main future works.
2. RELATED WORK
So far, both the research community and companies have devoted few effort to the physical design of DWs from the early stages of a DW project, and incorporate it within a global method that allows us to design all main aspects of DWs.
In [8], authors study the lifecycle of a DW and propose a method for the design, development and deployment of a DW. In this book, we can find a chapter devoted to the planning of the deployment of a DW and authors recommend us documenting all different deployment strategies. However, authors do not provide a standard technique for the formal modeling of the deployment of a DW.
In [17], authors deal with the design of a DWfrom the conceptual modeling up to its implementation. They propose the use of non-standard diagrams to represent the physical architecture of a DW: on one hand, to represent data integration processes and, on the other hand, to represent the relationship between the enterprise data warehouse and the different data marts that are populated from it. Nevertheless, these diagrams represent the architecture of the DW from a high level, without providing different levels of detail of the ulterior implementation of the DW.
In [4], several aspects of a DW implementation are discussed. Although in this book, other aspects of a DW implementation such as the paralelism, the partitioning of data in a RAID (Redundant Array of Inexpensive Disk) system or the use of a distributed database are tackled, authors do not provide a formal or standard technique to model all these aspects.
Finally, in [18], we find that one of the current open problems regarding DWs is the lack of a formal documentation that covers all design phases and provides multiple levels of abstraction (low level for designers and people devoted to the corresponding implementation, and high level for final users). The author argues that this documentation is absolutely basic for the maintenance and the ulterior extension of the DW. In this work, three different detail levels for DWs are proposed: data warehouse level, data mart level and fact level. At the first level, the use of the deployment diagrams of UML are proposed to document a DW architecture from a high level of detail. However, these diagrams are not integrated at all with the rest of techniques, models and/or methods used in the design of other aspects of the DW.
On the other hand, the use of UML for the design of databases has been studied in [14]. This book is structured around the database design process, therefore, it contains a chapter devoted to the database deployment. In this book it is stated that, from the database designers point of view, in a real database development project, “the biggest benefit in using the UML is the ability to model the tablespaces and quickly understand what tablespaces exist and how tables are partitioned across those tablespaces”.
Therefore, we argue that there is a still a need for providing a standard technique that allows us to model the physical design of a DW from early stages of a DW project. Another important issue for us is that this proposal is totally integrated in an overall approach that allows us to cover other aspects of the DW design such the conceptual or logical design of the DW or the modeling of ETL processes.
3. DATA WAREHOUSE DESIGN FRAMEWORK
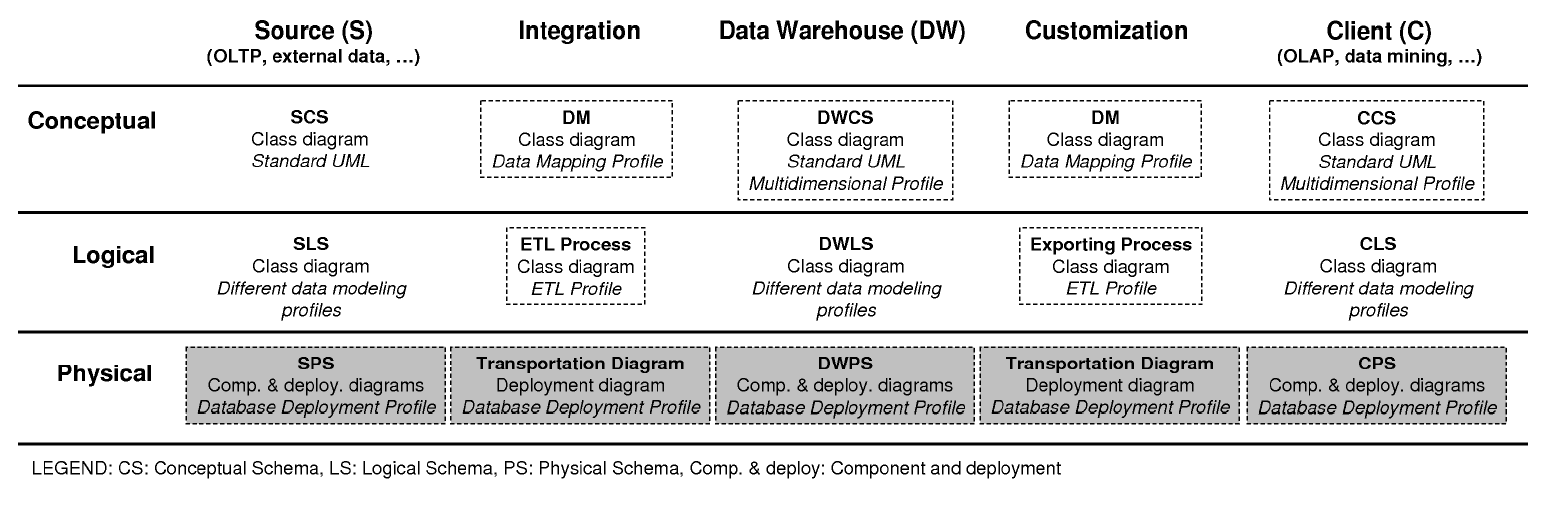
The architecture of a DW is usually depicted as various layers of data in which data from one layer is derived from data of the previous layer [6]. In a previous work [10], we have presented a DW development method, based on UML [16] and the UP [5], which addresses the design and development of both the DW back-stage and front-end. In our approach, we consider that the development of a DW can be structured into an integrated framework with five stages and three levels that define different diagrams for the DW model, as shown in Figure 1 and summarized next:
- Stages: we distinguish five stages in the definition of
a DW:
- Source, that defines the data sources of the DW, such as OLTP systems, external data sources (syndicated data, census data), etc.
- Integration, that defines the mapping between the data sources and the DW.
- Data Warehouse, that defines the structure of the DW.
- Customization, that defines the mapping between the DW and the clients’ structures.
- Client, that defines special structures that are used by the clients to access the DW, such as data marts (DM) or OLAP applications.
- Levels: each stage can be analyzed at three different
levels or perspectives:
- Conceptual: it defines the DW from a conceptual point of view.
- Logical: it addresses logical aspects of the DWdesign, such as the definition of the ETL processes.
- Physical: it defines physical aspects of the DW, such as the storage of the logical structures in different disks, or the configuration of the database servers that support the DW.
- Diagrams: each stage or level requires different modeling
formalisms. Therefore, our approach is composed
of 15 diagrams, but the DW designer does not need to
define all the diagrams in each DW project: for example,
if there is a straightforward mapping between
the Source Conceptual Schema (SCS) and the Data
Warehouse Conceptual Schema (DWCS), the designer
may not need to define the corresponding Data Mapping
(DM). In our approach, we use UML [16] as the
modeling language, because it provides enough expressiveness
power to address all the diagrams. As UML
is a general modeling language, we can use UML extension
mechanisms (stereotypes, tag definitions, and
constraints) to adapt UML to specific domains. A
stereotype is a UML modeling element that extends
the UML metamodel in a controlled way, i.e., a stereotype
is a specialized version of a standard UML element;
a tag definition allows additional information
about a standard UML element to be specified; and a
constraint is a rule that limits the behavior of a UML
element. In Figure 1, we provide the following information
for each diagram:
- Name (in bold face): the name we have coined for this diagram.
- UML diagram: the UML diagram we use to model this DW diagram. Currently, we use class, deployment, and component diagrams.
- Profile (in italic face): the dashed boxes show the diagrams where we propose a new profile1; in the other boxes, we use a standard UML diagram or a profile from other authors.
The different diagrams of the same DW are not independent but overlapping: they depend on each other in many ways. For example, changes in one diagram may imply changes in another, and a large portion of one diagram may be created on the basis of another diagram. For example, the Data Mapping (DM) is created by importing elements from the Source Conceptual Schema (SCS) and the Data Warehouse Conceptual Schema (DWCS). Moreover, our approach is flexible in the sense that the DW designer do not need to define all the diagrams one by one, but he can use what he needs when he needs it and continue moving forward as necessary.
In previous works, we have presented some of the diagrams and the corresponding profiles shown in white dashed boxes in Figure 1: Multidimensional Profile [11, 12] for the DWCS and the Client Conceptual Schema (CCS), the ETL Profile [19] for the ETL Process and the Exporting Process, and the Data Mapping Profile [13] for the DM between the SCS and the DWCS, and between the DWCS and the CCS. Finally, in light gray dashed boxes, we show the profile we present in this paper, the Database Deployment Profile, for modeling a DW at a physical level.
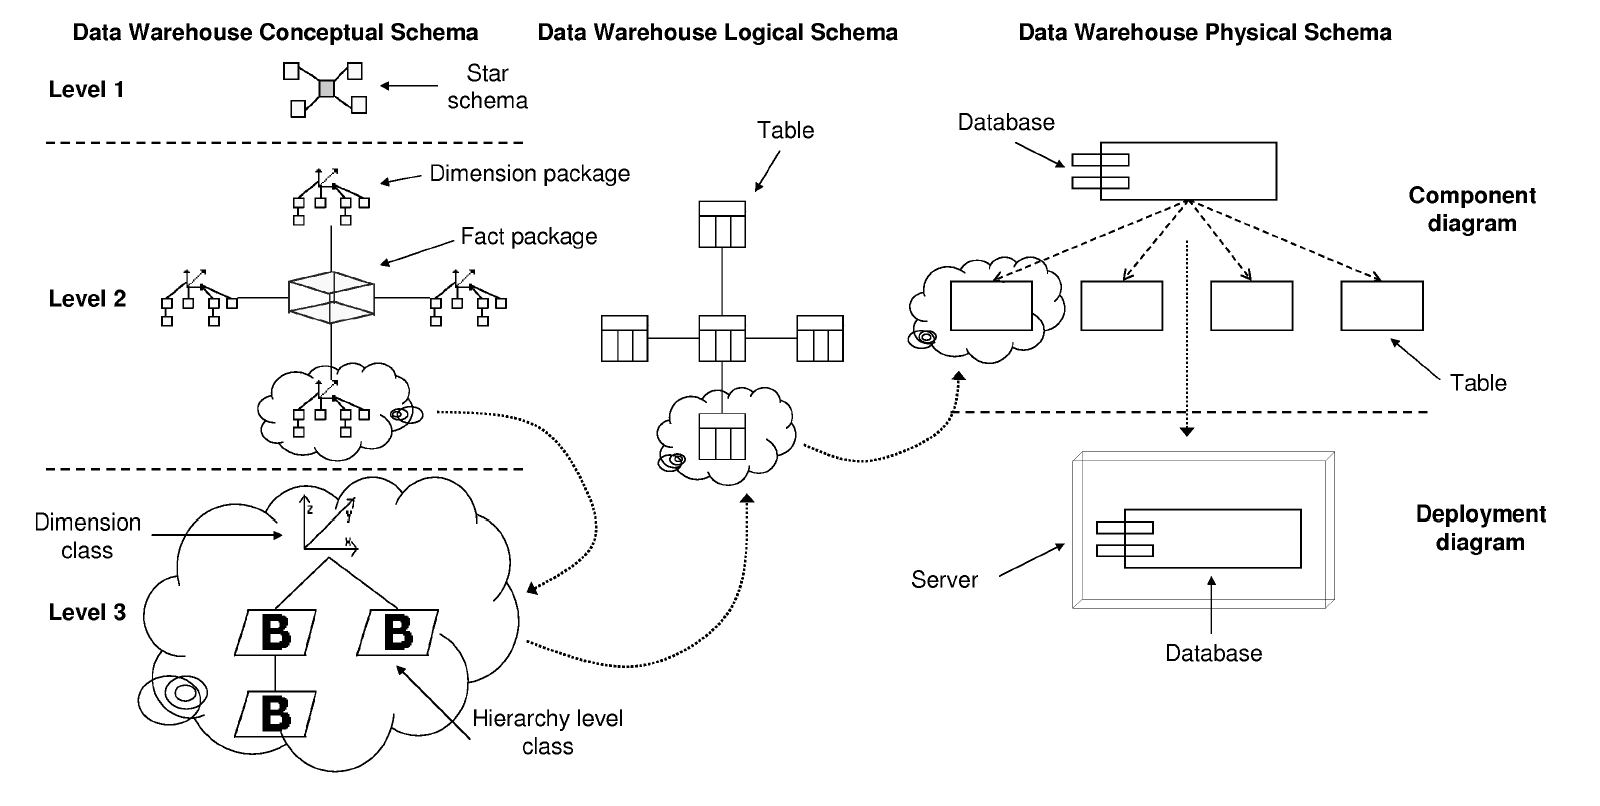
In Figure 2, we show a symbolic diagram that will help understanding our approach and the relationships between the different diagrams (DWCS, DWLS, and DWPS):
- On the left hand side of this figure we have represented the DWCS, which is structured into three levels: Level 1 or Model definition, Level 2 or Star schema definition, and Level 3 or Dimension/fact definition. The different elements drawn in this diagram are stereotyped packages and classes2 that represent MD concepts.
- From the DWCS, we develop3 the logical model (DWLS, represented in the middle of Figure 2) according to different options, such as ROLAP4 (Relational OLAP) or MOLAP5 (Multidimensional OLAP). In this example, we have chosen a ROLAP representation and each element corresponds to a table in the relational model.
- Finally, from the DWLS we derive the DWPS, which is represented on the right hand side of Figure 2. The DWPS shows the physical aspects of the implementation of the DW. This diagram is divided up into two parts: the component diagram, which shows the configuration of the logical structures used to store the DW, and the deployment diagram, which specifies different aspects relative to the hardware and software configuration.
Moreover, in Figure 2, we show how our approach allows the designer to trace the design of an element from the conceptual to the physical level. For example, in this figure, we have drawn a cloud around different elements that represent the same entity in different diagrams.
4. UML COMPONENT AND DEPLOYMENT DIAGRAMS
According to the UML Specification [16], “Implementation diagrams show aspects of physical implementation, including the structure of components and the run-time deployment system. They come in two forms: 1) component diagrams show the structure of components, including the classifiers that specify them and the artifacts that implement them; and 2) deployment diagrams show the structure of the nodes on which the components are deployed”.
4.1 Component diagram
The UML Specifion says that “A component represents a modular, deployable, and replaceable part of a system that encapsulates implementation and exposes a set of interfaces”. Components represent physical issues such as Enterprise JavaBeans, ActiveX components or configuration files. A component is typically specified by one or more classifiers (classes, interfaces, etc.) that reside on the component. A subset of these classifiers explicitly define the component’s external interfaces. Moreover, a component can also contain other components. However, a component does not have its own features (attributes, operations, etc.).
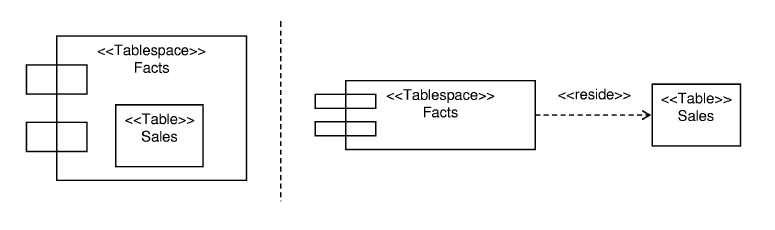
On the other hand, a component diagram is a graph of components connected by dependency relationships, which shows how classifiers are assigned to components and how the components depend on each other. In a component diagram (see Figure 3), a component is represented using a rectangular box, with two rectangles protruding from the left side.
In Figure 3, we show the two different representations of a component and the classifiers it contains:
- On the left hand side of the figure, the class (Sales) that resides on the component (Facts) is shown as nested inside the component (this indicates residence and not ownership).
- On the right hand side of the figure, the class is connected to the component by a «reside» dependency.
In this example, both the component and the class are stereotyped: the component is adorned with the «Tablespace» stereotype and the class with the «Table» stereotype; these stereotypes are defined in [14].
4.2 Deployment diagram
According to the UML Specification, “Deployment diagrams show the configuration of run-time processing elements and the software components, processes, and objects that execute on them”. A deployment diagram is a graph of nodes connected by communication associations. A deployment model is a collection of one or more deployment diagrams with their associated documentation.
In a deployment diagram, a node represents a piece of hardware (a computer, a device, etc.) or a software artifact (web server, database, etc.) in the system, and it is represented by a three-dimensional cube. A node may contain components, which indicates that the components run or execute on the node.
An association of nodes, which is drawn as a solid line between two nodes, indicates a line of communication between the nodes; the association may have a stereotype to indicate the nature of the communication path (e.g. the kind of channel, communication protocol or network).
There are two forms of deployment diagram:
- The descriptor form: it contains types of nodes and components. This form is used as a first-cut deployment diagram during the design of a system, when there is not a complete decision about the final hardware architecture.
- The instance form: it contains specific and identifiable nodes and components. This form is used to show the actual deployment of a system at a particular site, therefore it is normally used in the last steps of the implementation activity, when the details of the deployment site are known.
- Explore the issues involved with installing your system into production.
- Explore the dependencies that your system has with other systems that are currently in, or planned for, your production environment.
- Depict a major deployment configuration of a business application.
- Design the hardware and software configuration of an embedded system.
- Depict the hardware/network infrastructure of an organization.
UML deployment diagrams normally make an extensive use of visual stereotypes, because it makes easy to read the diagrams at a glance. Unfortunately, there are no standard palettes of visual stereotypes for UML deployment diagrams.
As it is suggested in [2], each node in a deployment diagram may have tens if not hundreds of software components deployed to it: the goal is not to depict all of them, but it is merely to depict those components that are vital to the understanding of the system.
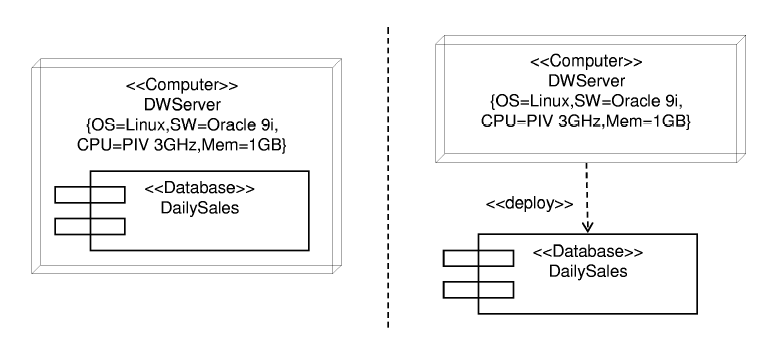
In Figure 4, we show the two different representations of a node and the components it contains:
- On the left hand side of the figure, the component (DailySales) that is deployed on the node (DWServer) is shown as nested inside the node.
- On the right hand side of the figure, the component is connected to the node by a «deploy» dependency.
In this example, both the node and the component are stereotyped: the node with the «Computer» stereotype and the component with the «Database» stereotype. Moreover, the node DWServer contains a set of tagged values (OS, SW, CPU, and Mem) that allow the designer to describe the particular characteristics of the node.
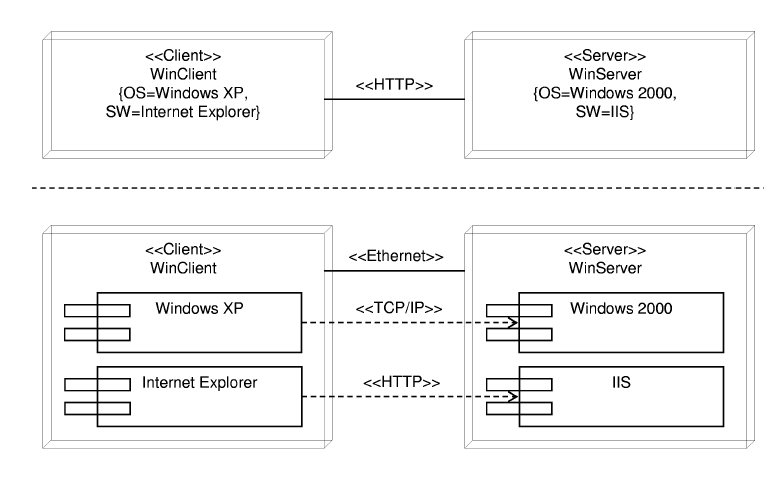
A deployment diagram can be specified at different levels of detail. For example, in Figure 5, we show two versions of the same deployment diagram. At the top of Figure 5, the software deployed in the nodes is specified by means of tagged values. Moreover, the association between the nodes is only adorned with the «HTTP» stereotype (HyperText Transfer Protocol), although different protocols can be used in the communication. At the bottom of Figure 5, the software deployed in the nodes is depicted as components and different stereotyped dependencies («TCP/IP» and «HTTP») indicate how one component uses the services of another component. However, there are more display possibilities: for example, the designer can omit the tagged values in the diagram and capture them only in the supported documentation.
5. DATA WAREHOUSE PHYSICAL DESIGN
In Section 3, we have briefly described our design method for DWs. Within this method, we use the component and deployment diagrams to model the physical level of DWs. To achieve this goal, we propose the following five diagrams, which correspond with the five stages presented in Section 3:
- Source Physical Schema (SPS): it defines the physical configuration of the data sources that populate the DW.
- Integration Transportation Diagram (ITD): it defines the physical structure of the ETL processes that extract, transform and load data into the DW. This diagram relates the SPS and the next diagram.
- Data Warehouse Physical Schema (DWPS): it defines the physical structure of the DW itself.
- Customization Transportation Diagram (CTD): it defines the physical structure of the exportation processes from the DW to the specific structures employed by clients. This diagram relates the DWPS and the next diagram.
- Client Physical Schema (CPS): it defines the physical configuration of the structures employed by clients in accessing the DW.
The SPS, DWPS, and CPS are based on the UML component and deployment diagrams, whereas ITD and CTD are only based on the deployment diagrams. These diagrams reflect the modeling aspects of the storage of data [14], such as the database size, information about where the database will reside (hardware and software), partitioning of the data, properties specific to the DBMS (Database Management System) chosen, etc.
The five proposed diagrams use an extension of UML that we have called Database Deployment Profile, which is formed by a series of stereotypes, tagged values and constraints. Due to the lack of space, we do not include the formal definition of this extension in this paper.

Throughout the rest of this paper, we are going to use an example to introduce the different diagrams we propose. In this example, final users need a DW that contains the daily sales of a company that do business with automobiles (cars and trucks). There exist two data sources: the sales server, which contains the data about transactions and sales, and the CRM (Customer Relationship Management) server, which contains the data about the customers who buy products.
Following our approach [12], we structure the conceptual model into three levels:
- Level 1 : Model definition. A package represents a star schema of a conceptual MD model. A dependency between two packages at this level indicates that the star schemas share at least one dimension, allowing us to consider conformed dimensions.
- Level 2 : Star schema definition. A package represents a fact or a dimension of a star schema. A dependency between two dimension packages at this level indicates that the packages share at least one level of a dimension hierarchy.
- Level 3 : Dimension/fact definition. A package is exploded into a set of classes that represent the hierarchy levels defined in a dimension package, or the whole star schema in the case of the fact package.
In Figure 6, we show the first level of the DWCS, which represents the conceptual model of the DW. In our example, the first level is formed by a single package called Auto-sales schema.
In Figure 7, we show the second level of the DWCS. The fact package Auto-sales fact is represented in the middle of the figure, while the dimension packages are placed around the fact package. As seen in Figure 7, a dependency is drawn from the fact package Auto-sales fact to each one of the dimension packages, because the fact package comprises the whole definition of the star schema, and therefore, uses the definitions of dimensions related to the fact.
In Figure 8, we show the level 3 of the DWCS. In order to avoid a cluttered diagram, we only show the attributes of the fact class (Auto-sales) and two dimension classes (Salesperson and Customer).
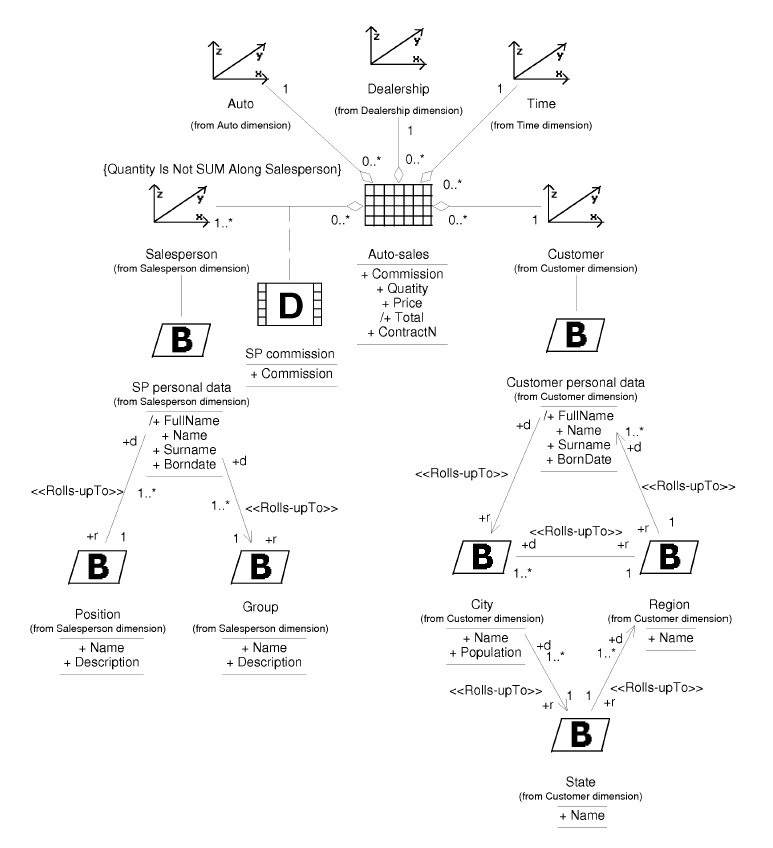
In Figure 9, we show the Data Warehouse Logical Schema (DWLS), which represents the logical model of the DW. In this example, a ROLAP system has been selected for the implementation of the DW, which means the use of the relational model in the logical design of the DW. In Figure 9, six classes adorned with the stereotype «Table» are showed: Auto, Customer, Dealership, Salesperson, and Time are represented by means of the icon of the stereotype, whereas the table Auto-sales appears with the icon of the stereotype inside the typical representation of a class in UML.
In order to avoid a cluttered diagram, we only display the attributes of Auto-sales and Salesperson. In the Auto-sales table, the attributes IdAuto, IdCustomer, IdDealership, Id- Salesperson, and IdTime are the foreign keys that connect the fact table with the dimension tables, whereas the attributes Commission, SP_Commission, Quantity, Price, and Total (derived attribute that is precalculated for performance reasons) represent the measures of the fact table. In the Salesperson table, we can notice that this table contains all the attributes of the different dimension levels (see Figure 8) following the star schema approach [7]; some attributes have changed their names in order to avoid repeated names. Moreover, some design decisions have been taken: the degenerate dimension represented by the ContractN attribute in Autosales fact class (see Figure 8) has been omitted, and the degenerate fact represented by the SP commission class is represented by the SP_Commission attribute in the Autosales table.

5.1 Source Physical Schema
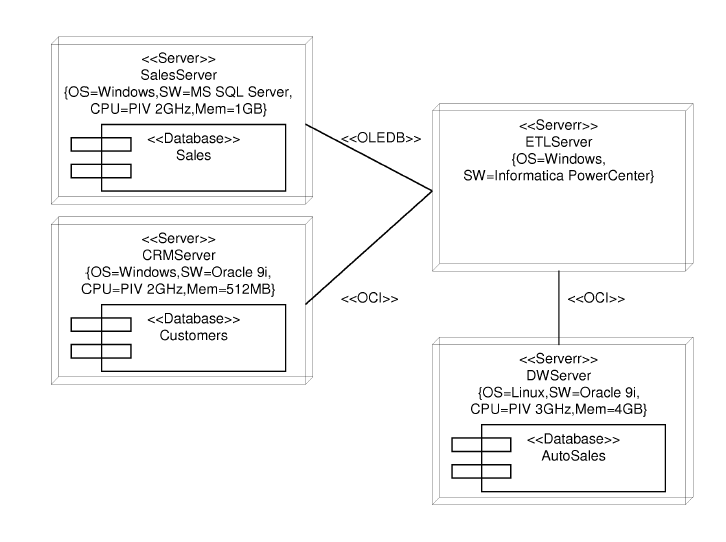
The SPS describes the origins of data of the DW from a physical point of view. In Figure 10, we show the SPS of our example, which is formed by two servers called SalesServer and CRMServer; for each one of them, the hardware and software configuration is displayed by means of tagged values. The first server hosts a database called Sales, whereas the second server hosts a database called Customers.
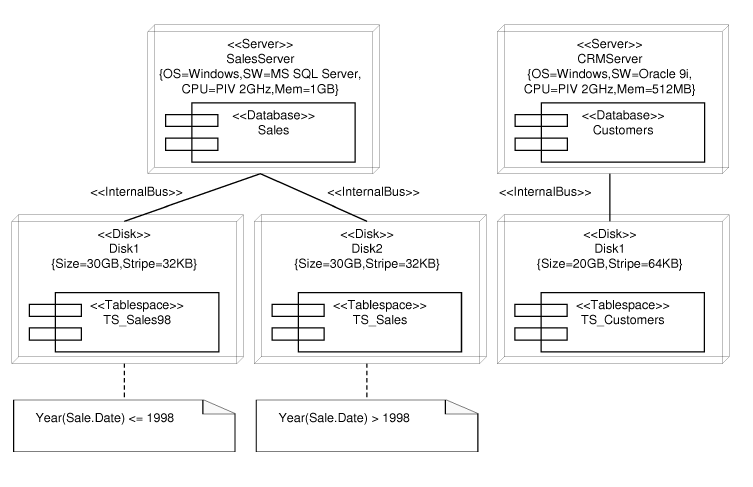
In our Database Deployment Profile, when the storage system is a RDBMS (Relational Database Management System), we make use of the UML for Profile Database [14] that defines a series of stereotypes like «Database», «Schema», or «Tablespace». Moreover, we have defined our own set of stereotypes: in Figure 10, we can see the stereotypes «Server» that defines a computer that performs server functions, «Disk» to represent a physical disk drive and «InternalBus» to define the type of communication between two elements. In our approach, we represent the configuration parameters of the tablespaces (e.g., size of the tablespace) by means of tagged values; however, these parameters vary greatly depending on the DBMS, so we only provide a set of common parameters. As UML is extensible, the designer can add additional tagged values as needed to accomplish all the modeling needs of a particular DBMS.
Moreover, whenever we need to specify additional information in a diagram, we make use of the UML notes to incorporate it. For example, in Figure 10 we have used two notes to indicate how the data is distributed into the two existing tablespaces: the tablespace TS_Sales98 holds the data about the sales before or in 1998, whereas the tablespace TS_Sales holds the sales after 1998.
5.2 DataWarehouse Physical Schema
The DWPS shows the physical aspects of the implementation of the DW. This diagram is divided up into two parts: the component diagram and the deployment diagram. In the first diagram, the configuration of the logical structures used to store the DW is shown. For example, in Figure 11, we can observe that the DW is implemented by means of a database called AutoSales, which is formed by two tablespaces called Facts and Dimensions: the first tablespace hosts the table Auto-sales and the second tablespace hosts the tables Auto, Customer, Dealership, Salesperson, and Time. Below the name of each table, the text (from ROLAP) is included, which indicates that the tables have been previously defined in a package called ROLAP (Figure 9). It is important to highlight that the logical structured defined in the DWLS are reused in this diagram and, therefore, we avoid any possibility of ambiguity or incoherence.

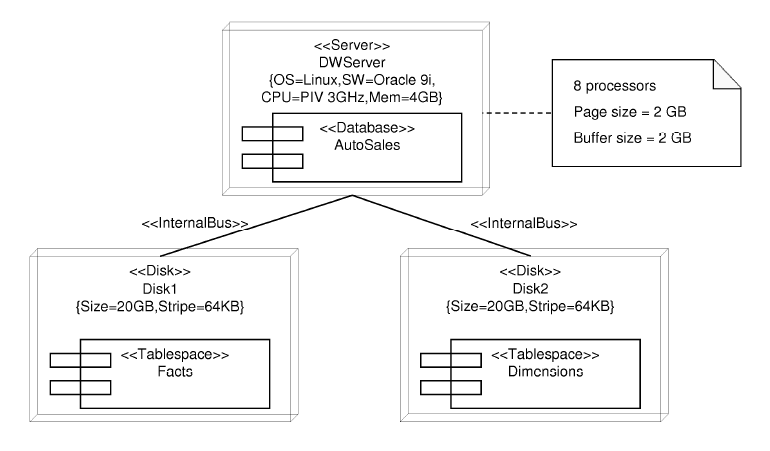
In the second diagram, the deployment diagram, different aspects relative to the hardware and software configuration are specified. Moreover, the physical distribution of the logical structures previously defined in the component diagrams is also represented. For example, in Figure 12, we can observe the configuration of the server that hosts the DW.
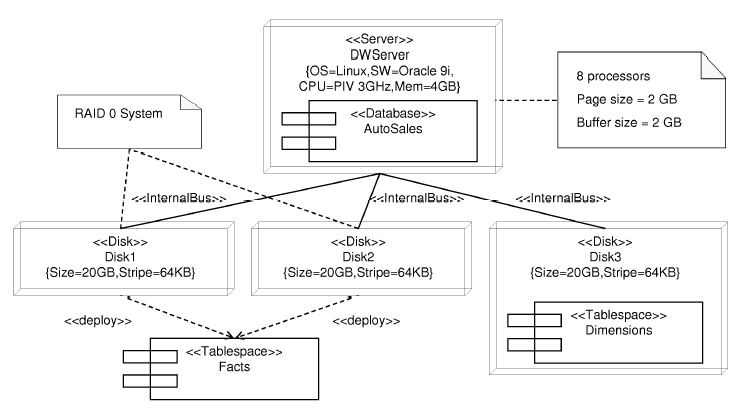
One of the advantages of our proposal is that it allows to evaluate and to discuss different implementations during the first stages in the design of a DW. In this way, the designer can anticipate some implementation or performance problems. For example, an alternative configuration of the physical structure of the DW can be established, as we show in Figure 13. In this second alternative, a RAID 0 systems has been chosen to host the tablespace Facts in order to improve the response time of the disk drive and the performance of the system in general. From these two alternative configurations, the DW designer and the DW administrator can discuss the pros and cons of each option.
5.3 Integration Transportation Diagram
The ITD defines the physical structure of the ETL processes used in the loading of data in the DW from the data sources. On the one hand, the data sources are represented by means of the SPS and, on the other hand, the DW is represented by means of the DWPS. Since the SPS and the DWPS have been defined previously, in this diagram we do not have to define them again, but they are imported.
For example, the ITD for our running example is shown in Figure 14. On the left hand side of this diagram, different data source servers are represented: SalesServer and CRMServer, which have been previously defined in Figure 10; on the right hand side, the DWServer, previously defined in Figure 12, is shown. In this figure, the ETLServer is introduced, an additional server that is used to execute the ETL processes. This server communicates with the rest of the servers by means of a series of specific protocols: OLEDB to communicate with SalesServer because it uses Microsoft SQLServer7 and OCI (Oracle Call Interface) to communicate with CRMServer and DWServer because both of them use Oracle.
5.4 Client Physical Schema
The CPS defines the physical structure of the specific structures that are used by the clients to access the DW. Diverse configurations exist that can be used: exportation of data to data marts, use of an OLAP server, etc. In our example, we have chosen a client/server architecture and the same DW server provides access to data for the clients. Therefore, we do not need to define a specific structure for the clients.
5.5 Customization Transportation Diagram
The CTD defines the exportation processes from the DW towards the specific structures used by the clients. In this diagram, the DW is represented by means of the DWPS and clients are represented by means of the CPS. Since the DWPS and the CPS have been previously defined, in this diagram we do not have to define them again, but they are directly imported.
For example, in Figure 15, the CTD of our running example is shown. On the left hand side of this diagram, part of the DWPS, which has been previously defined in Figure 12, is shown; on the right hand side, three types of clients who will use the DW are shown: a Web client with operating system Apple Macintosh, a Web client with operating system Microsoft Windows and, finally, a client with a specific desktop application (MicroStrategy) with operating system Microsoft Windows. Whereas both Web clients communicate with the server by means of HTTP, the desktop client uses ODBC (they Open Connectivity Database).

6. CONCLUSIONS AND FUTURE WORK
After about 15 years of research and development in Data Warehouses (DW), few efforts have been dedicated to the modeling of the physical design of a DW from the early stages of a project. In this paper, we have presented an adaptation of the component and deployment diagrams of the Unified Modeling Language (UML), the standard graphical notation for modeling software application needs, for the modeling of the physical design of a DW. This proposal is part of our DW engineering process [10] that tackles the design and development of both the DW back-stage and front-end. Our method provides a unifying framework that facilitates the integration of different DW models. For example, the DW designers work with the DW administrators to understand the storage needed for the data. Thanks to our approach, they can coordinate their efforts to include the hardware configuration (servers and drives necessary for the data) as well as the best way to organize the data into the database logical structures (tablespaces and tables).
Thanks to the use of the component and deployment diagrams, a DW designer can specify both hardware, software, and middelware needs for a DW project. The main advantages provided by our approach are as follows:
- It is part of an integrated approach in which we use different diagrams -always following the same standard notation based on UML, for modeling all main aspects of a DW.
- Traceability of the design of a DW, from the conceptual model up to the physical model.
- Reducing the overall development cost as we accomplish implementation issues from the early stages of a DW project. We should take into account that modifying these aspects in ulterior design phases may result in increasing the total cost of the project.
- Different levels of abstraction by providing different levels of details for the same diagram.
Moreover, since our approach is based on UML, there are different CASE (Computer-Aided Software Engineering) tools that can support our entire approach and having the entire design in one language (UML) breaks down the barriers of communication between the different participants in a DW project.
Regarding future works, we are working on the formal definition of our proposal by means of Object Constraint Language (OCL). Moreover, we plan to provide guidelines on developing a DW by means of our DW engineering process. These guidelines will include validation checks to ensure that nothing is missed when going from one step to the next.
7. ACKNOWLEDGMENTS
We would like to thank Panos Vassiliadis for his helpful comments during the writing of the first version of this paper. This work has been partially supported by the HIDRA project (TIC2001-3530-C02-02) from the Spanish Ministry of Education and Science.
8. REFERENCES
[1] A. Abelló, J. Samos, and F. Saltor. A Framework for the Classification and Description of Multidimensional Data Models. In Proceedings of the 12th International Conference on Database and Expert Systems Applications (DEXA’01), volume 2113 of Lecture Notes in Computer Science, pages 668–677, Munich, Germany, September 2001. Springer-Verlag.
[2] S. Ambler. A UML Profile for Data Modeling. Internet: http://www.agiledata.org/essays/- umlDataModelingProfile.html, 2002.
[3] M. Blaschka, C. Sapia, G. Höfling, and B. Dinter. Finding your way through multidimensional data models. In Proceedings of the 9th International Conference on Database and Expert Systems Applications (DEXA’98), volume 1460 of Lecture Notes in Computer Science, pages 198–203, Vienna, Austria, August 1998. Springer-Verlag.
[4] W. Giovinazzo. Object-Oriented Data Warehouse Design. Building a star schema. Prentice-Hall, 2000.
[5] I. Jacobson, G. Booch, and J. Rumbaugh. The Unified Software Development Process. Object Technology Series. Addison-Wesley, 1999.
[6] M. Jarke, M. Lenzerini, Y. Vassiliou, and P. Vassiliadis. Fundamentals of Data Warehouses. Springer-Verlag, 2 edition, 2003.
[7] R. Kimball. The Data Warehouse Toolkit. John Wiley & Sons, 1996. (Last edition: 2nd edition, John Wiley & Sons, 2002).
[8] R. Kimball, L. Reeves, M. Ross, and W. Thornthwaite. The Data Warehouse Lifecycle Toolkit. John Wiley & Sons, 1998.
[9] S. Luján-Mora and J. Trujillo. A Comprehensive Method for Data Warehouse Design. In Proceedings of the 5th International Workshop on Design and Management of Data Warehouses (DMDW’03), pages 1.1–1.14, Berlin, Germany, September 2003.
[10] S. Luján-Mora and J. Trujillo. A Data Warehouse Engineering Process. In Proceedings of the 3rd Biennial International Conference on Advances in Information Systems (ADVIS’04), Lecture Notes in Computer Science, Izmir, Turkey, October 2004. Springer-Verlag.
[11] S. Luján-Mora, J. Trujillo, and I. Song. Extending UML for Multidimensional Modeling. In Proceedings of the 5th International Conference on the Unified Modeling Language (UML’02), volume 2460 of Lecture Notes in Computer Science, pages 290–304, Dresden, Germany, September 2002. Springer-Verlag.
[12] S. Luján-Mora, J. Trujillo, and I. Song. Multidimensional Modeling with UML Package Diagrams. In Proceedings of the 21st International Conference on Conceptual Modeling (ER’02), volume 2503 of Lecture Notes in Computer Science, pages 199–213, Tampere, Finland, October 2002. Springer-Verlag.
[13] S. Luján-Mora, P. Vassiliadis, and J. Trujillo. Data Mapping Diagrams for Data Warehouse Design with UML. In Proceedings of the 23rd International Conference on Conceptual Modeling (ER’04), Lecture Notes in Computer Science, Shanghai, China, November 2004. Springer-Verlag.
[14] E. Naiburg and R. Maksimchuk. UML for Database Design. Object Technology Series. Addison-Wesley, 2001.
[15] M. Nicola and H. Rizvi. Storage Layout and I/O Performance in Data Warehouses. In Proceedings of the 5th International Workshop on Design and Management of Data Warehouses (DMDW’03), pages 7.1–7.9, Berlin, Germany, September 2003.
[16] Object Management Group (OMG). Unified Modeling Language Specification 1.5. Internet: http://www.omg.org/cgi-bin/doc?formal/03-03-01, March 2003.
[17] V. Poe, P. Klauer, and S. Brobst. Building a Data Warehouse for Decision Support. Prentice-Hall, 2 edition, 1998.
[18] S. Rizzi. Open problems in data warehousing: eight years later. In Proceedings of the 5th International Workshop on Design and Management of Data Warehouses (DMDW’03), Berlin, Germany, September 2003.
[19] J. Trujillo and S. Luján-Mora. A UML Based Approach for Modeling ETL Processes in Data Warehouses. In Proceedings of the 22nd International Conference on Conceptual Modeling (ER’03), volume 2813 of Lecture Notes in Computer Science, pages 307–320, Chicago, USA, October 2003. Springer-Verlag.
[20] J. Trujillo, M. Palomar, J. Gómez, and I. Song. Designing Data Warehouses with OO Conceptual Models. IEEE Computer, special issue on Data Warehouses, 34(12):66–75, December 2001.